Download
1 / 47
470 likes | 571 Views
Public Health Response to Disability in America. Edwin Trevathan, MD, MPH Gloria Krahn, PhD, MPH.

E N D
Public Health Response to Disability in America Edwin Trevathan, MD, MPH Gloria Krahn, PhD, MPH
The findings and conclusions in this presentation have not been formally disseminated by the Centers for Disease Control and Prevention (CDC) and should not be construed to represent any agency determination or policy.
Transitions… …..to new opportunities
Changing the View of Disability …from defect to diversity …from burden to resource …from a life of poverty to “a good life”
The Changing View of Disability in Public Health Role of NCBDDD and its partnership with AUCD in Responding to Disability
Changing View of Disability in Public Health How disability is viewed How public health should respond to disabilities Two decades of tremendous change in:
Quick Facts • In 2006 nearly 14% of children under age 18 were identified with special needs. • Rise in chronic conditions such as asthma (9% of children and adolescents) and obesity (18% of school-aged children) • 1 in 33 infants is born with a birth condition associated with disability
Quick Facts • 40-50 million persons 18 years or older report having a disability (1 in 5). • People with disabilities are heterogeneous but, as a group, • Less likely to report excellent/very good health (27% vs. 60%), with poorest health reported by Hispanics and Native Americans with disabilities • People with disabilities report more smoking, physical inactivity, and being overweight/obese.
History of Public Health and Disability Historical tensions between disability community and public health: Distrust by disability advocates Prevention vs the needs of persons with disabilities Concern of devaluation of persons with disabilities Health economics and recognizing public cost
Public Health Functions and Model Addressing health of populations through: Surveillance Research Prevention Public Health Model Surveillance Research Prevention
Continuum of Prevention 1. Preventing occurrence of conditions 2. Preventing limitations related to conditions 3. Preventing secondary conditions 4. Promoting health and quality of life of people with disabling conditions
1. Preventing Occurrence of Conditions Methods Surveillance for primary condition Determine cause Identify preventive action Implement policies and public awareness Example Neural Tube Defects Emerging Areas Prenatal influences on adult onset disorders Maternal diabetes and child health
2. Preventing Limitations of Conditions Methods Screening for identification (e.g., newborn) Identify interventions to prevent limitations Systems to support individual interventions Example PKU, hearing loss Emerging Areas Deep Vein Thrombosis, Congenital heart defects
3. Preventing Secondary Conditions Methods Surveillance of secondary conditions (physical, social conditions) Identify effective interventions Implement interventions (generic/disability specific) Examples Obesity in persons with mobility/IDD Emerging Areas: Health disparities and health care access for adults Environmental access
4. Promoting Health and Quality of Life Methods Surveillance of health and QOL Identify determinants of health and QOL Create policies and programs that promote optimal health and QOL Examples Health promotion programs Emerging Areas: Strengths-based approaches; Perspectives of PWD in measurement
First Decade of the Changing View 1988 First paper on preventing “secondary disabilities” 1990 ADA 1991 IOM Disability in America 1993 CDC conference on preventing secondary conditions in people with Cerebral Palsy and Spina Bifida; 1994- Health care debate, managed care, health care of CSHCN and people with disabilities 1997 IOM Enabling America 1999 “Disability Paradox” 1990s Health promotion interventions
II. Public Health “Policy” on Disability Healthy People 2010 (2000) Inclusive and extensive planning process Objectives require an extant, ongoing data set Chapter 6 on Disability and Secondary Conditions 13 objectives and references in ~1/4 of all other objectives
Healthy People 2010 standard definition depression (child and adult) social participation emotional support life satisfaction congregate care Chapter 6 with 13 disability objectives (HHS) • employment • educational inclusion • accessible health programs • assistive devices/technology • environmental barriers • surveillance and health promotion
International Classification of Functioning, Disability and Health (WHO, 2001) Departure from diagnostic approach to emphasize: Function Participation Environment Redefining disability as interface of person with environment Attention to environments
From the Surgeons General 2002 Closing the Gap: A National Blueprint to Improve the Health of Persons with Mental Retardation 2005 Call to Action to Improve the Health and Wellness of Persons with Disabilities
Closing the Gap—Satcher Health promotion Research Health care quality Train HC providers HC financing Sources of HC
Call to Action—Carmona, 2005 Topic Area Health promotion Research Health care quality Train HC providers HC financing Sources of HC Public Attitude SG’02SG’05 √ √ √ (√) √ -- √ √ √ -- √ √ -- √
Future of Disability in America—IOM (2007) Disability monitoring Use and improve ICF; Comprehensive monitoring system Disability research Adequately fund research; Increase visibility and coordination of research Access to health care and supports Accessibility of facilities; Insurance; AT; coordinated care for transition Public and Professional Education Tools for professionals; Public awareness campaign on assistive and accessible technologies
PH Priorities for Disability Topic Area Health promotion Research Health care quality Train HC providers HC financing Sources of HC Public Attitude Surveillance SG’02SG’05IOM’07 √ √ (√) √ (√) √ √ -- √ √ √ √ √ -- √ √ √ √ -- √ √ -- -- √
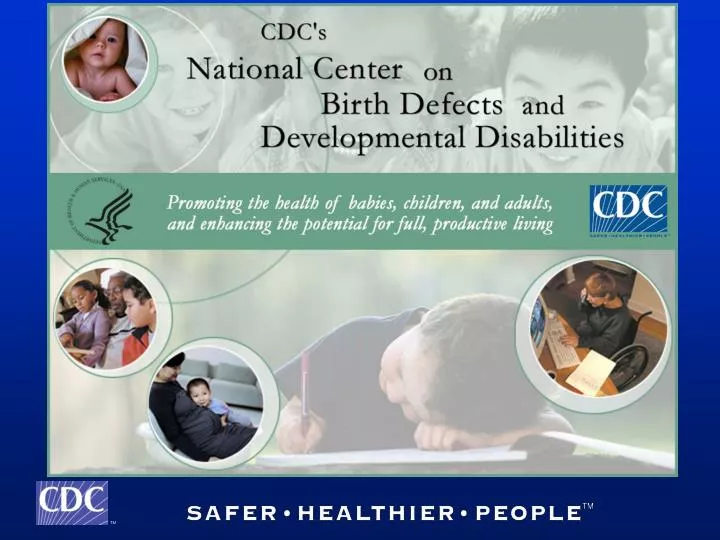
National Center on Birth Defects and Developmental Disabilities Mission: To promote the health of babies, children, and adults, and enhance the potential for full, productive living. Goals: • Prevent or reduce birth defects and developmental disabilities. • Improve the health and development of all people with disabilities or potentially disabling conditions, including blood disorders.
The History of the National Center on Birth Defects and Developmental Disabilities • Established in October 2000 by The Children’s Health Act of 2000 (Public Law 106-310) • National Center on Birth Defects and Developmental Disabilities created at CDC in April 2001 • Reauthorized in December 2003 • Jose Cordero, Director (2001-06) • Edwin Trevathan, Director (2007- )
DIVISION OF BLOOD DISORDERS DIVISION OF BIRTH DEFECTS AND DEVELOPMENTAL DISABILITIES DIVISION OF HUMAN DEVELOPMENT AND DISABILITY NATIONAL CENTER ON BIRTH DEFECTS AND DEVELOPMENTAL DISABILITIES HEALTH COMMUNICATION SCIENCE TEAM SCIENCE AND PUBLIC HEALTH TEAM POLICY, PLANNING AND EVALUATION TEAM RESOURCE MANAGEMENT OFFICE U.S. Department of Health and Human Services Centers for Disease Control and Prevention
Some Success Stories • 26% Reduction in neural tube defects in U.S. - folic acid fortification –approx 1000 babies a year • 143 Hemophilia Treatment centers - more people with hemophilia leading longer, healthier lives • Expansion of early hearing detection programs to 46 states and territories • Documented effectiveness of health promotion programs for persons with disabilities • State centers expanded to study autism surveillance and research causes/risk factors
NTD Prevalence changes in the Americas before and after folic acid fortification Rate per 10,000 live births Before fortification After fortification 20 17.0 15.8 15 NTD rate per 10,000 10.6 10.1 9.7 10 8.6 7.6 6.3 5 0 USA Canada Costa Rica Chile
Current NCBDDD Priorities Birth Defects and Autism/Developmental Disabilities Research
CDC Funding for Birth Defects Activities Centers for Birth Defects Research & Prevention Arkansas North Carolina California Iowa CDC/Georgia Texas Massachusetts Utah New York State Monitoring 2005-2010 2003-2008 Arizona Florida Illinois New Jersey New York Ohio Puerto Rico Vermont Colorado Michigan Minnesota New Hampshire Oklahoma Rhode Island Virginia
The Autism and Developmental Disabilities Monitoring (ADDM) Network • Goals- • Accurate and comparable population-based estimates of the prevalence of ASD in selected regions of U.S. • Describe the characteristics of children with ASD • Examine trends in prevalence • To improve the consistency of identification of people with ASDs ASD Prevalence- • Prevalence estimates for 2000 and 2002 surveillance years were 6.6 and 6.7 per 1,000 children with an ASD. • CDC is working to develop additional prevalence estimates for 2004 and 2006. Current ADDM Sites
Centers for Autism and Developmental Disabilities Research and Epidemiology Colorado Department of Public Health and Environment Kaiser Permanente Division of Research Johns Hopkins University University of North Carolina at Chapel Hill University of Pennsylvania CDC-Georgia CADDRE
Current NCBDDD Priorities Longitudinal Data on Disabilities
State Implementation Projects for Preventing Secondary Conditions and Promoting the Health of People with Disabilities California Oregon Montana North Dakota Kansas Iowa Arkansas New York Massachusetts Delaware Michigan Illinois Virginia North Carolina South Carolina Florida
Current NCBDDD Priorities Racial and Ethnic Disparities among People with Birth Defects, Disabilities and Blood Disorders
12 Hispanic White 10 Black 8 6 4 2 0 1995 1996 1997 1998 1999 2000 2001 2002 2003 Impact of Fortification: 26% Reduction of Neural Tube Defects (Spina Bifida and Anencephaly) Prevalence (per 10,000) Pre-fortification Fortification Year of birth
Current NCBDDD Priorities Addressing Deep Vein Thrombosis
Risk Factors for Venous Thromboembolism (VTE) Aging Chronic Illness Pregnancy Hospitalization Genetics Motor Disability
Learn the Signs. Act Early. Campaign • Raise awareness of developmental milestones and • early warning signs of developmental delay. • Increase knowledge about the benefits of early • action and early intervention. • Increase parent-provider dialogue on the topic of • developmental milestones and disorders. • Increase early action for developmental disorders
Partnering for the future: NCBDDD and AUCD Mechanism—Cooperative Agreement: 1. Research Topics of Interest (RTOIs) 2. Fellowships 3. TA to Disability & Health network 4. Input to Healthy People 2020 5. Other ideas? Mechanism—Conference Funds Partial support for conferences