Download
1 / 48
480 likes | 569 Views
Modeling Neural Network Connectivity at Rest and During Tasks with fMRI and ERP data: An Overview. Donald A. Robin, PhD Rachel Hutson , BA Chief, Human performance Division Research Imaging Institute Professor Neurology, Radiology, Biomedical Engineering

E N D
Modeling Neural Network Connectivity at Rest and During Tasks with fMRI and ERP data: An Overview Donald A. Robin, PhD Rachel Hutson, BA Chief, Human performance Division Research Imaging Institute Professor Neurology, Radiology, Biomedical Engineering University of Texas health science center at san Antonio
Brain Connectivity Anatomical Functional Effective
Activation Likelihood Estimation (ALE) Reported foci of activation are treated as spatial probability distributions centered at given coordinates. Permutation tests are calculated to obtain an ALE null-distribution to identify convergence of foci across studies differentiated from random clustering (limited to gray matter). The histogram of the ALE scores following permutations is used to assign P values. False Discovery Rate and minimum volume (mm3) thresholds are applied to determine statistical significance. Inference reflects a null-hypothesis of random spatial association between experiments (i.e., random effects).
Goals To develop an ontological system of describing function–structure correspondences To develop a probabilistic atlas of function-structure correspondence To develop a probabilistic atlas of inter-regional correspondence
Inclusion Criterion A study is included in BrainMap if: It is published in a peer-reviewed, English-language journal Reports peaks of activation in MNI or Talaraich coordinates Reports whole-brain analyses
Coding Scheme Description of subjects Experimental conditions Stimulus input Response modality Instructions
Coded Meta-data Context: purpose of the work (e.g., normal mapping, age effects, disease effects, drug effects) Behavioral Domain: neural systems studied: cognition, action, perception, emotion, interoception, or pharmacology. Paradigm class: challenege presented – e.g., anti-saccades, Stroop, reward-based learning.
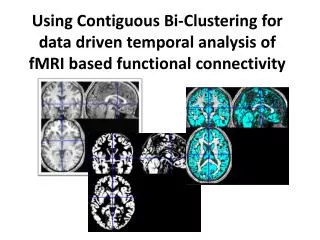
Resting State fMRI Uncovers intrinsic brain networks associated with specific systems (e.g., motor, attention) and a more general Default Mode Network that deactivates during task Low frequency fluctuations in BOLD signal that are coherent in networks associated with a given function
Resting State fMRI • Represent a relatively permanent brain state • Unbiased by task • Extremely robust - present during sleep and even anesthesia, present in non-human primates and perhaps non-primates • Connectivity is related to a given state or subject characteristic (e.g., perceptual measures of voice)
Resting State fMRI • High Clinical Potential • Subjects simply lies still in the scanner with eyes closed • Sequence <10 minutes (ours is 8) • Sensitive to disease/pathology • Network connectivity is known to systematically change (are malleable, show neuroplasticity) with behavioral training or treatment
Two Analysis Approaches to RSN Region of interest (ROI) or Independent Component Analysis (ICA) In part, choice depends on questions and if a theory or existing data can drive ROI selection ICA preferred if no driving theory for example We used a ROI seed based approach as we knew what areas would isolate vocalization network from general speech network
Default Mode Network (DMN) Identified using ICA of resting-state data Numerous disorders have alterations in the DMN Malaak N. Moussa, et al., 2012.
DCM (Bayesian Models) Generative models of brain responses that provide posteriorestimates of effective strength of synaptic connections and their context dependency
DCM (Bayesian Models) Dynamic using differential equations for describing (hidden) neuronal dynamics Causal (control theory) as they describe how dynamics in one population cause dynamics in another and how these interactions are modulated by experimental manipulation or endogenous brain activity
DCMs DCMs strive for neurophysiological interpretability Use of a biophysically motivated and parameterized forward model to link modeled neuronal dynamics to measured data Are Bayesian, thus predictive; each parameter is constrained by a prior distribution
Hypothesis abouta neural system The DCM cycle Statistical test on parameters of optimal model Definition of DCMs as systemmodels Bayesian modelselection of optimal DCM Design a study thatallows to investigatethat system Parameter estimationfor all DCMs considered Data acquisition Extraction of time seriesfrom SPMs
DCM for ERP • DCM estimates effective connectivity • The influence one neuronal system has over another • DCM for ERP estimates effective connectivity by inverting a spatiotemporal forward model of the observed EEG data • In this study we used dynamic causal modeling (DCM) to model effective connectivity of ERP responses to pitch perturbation in voice auditory feedback in musicians with relative pitch (RP), absolute pitch and non-musician controls.
Effective Connectivity Associated with Auditory Error Detection in Musicians with Absolute Pitch(Parkinson et al, 2014, Front. Neurosci. PMID 24634644) Pitch-shift Paradigm Subjects listen to their own voice being played back in headphones while vocalizing Unexpected shifts are introduced to the feedback and subjects respond by shifting their own voice in the opposite direction to the shift This response is known as the pitch-shift reflex Upward pitch-shift Black lines: control Red lines: voice F0 +30 cents
Pitch–shift methods 11 subjects were recruited to each of the absolute pitch (AP), relative pitch (RP) and non-musician (NM) groups. Subjects sustained vowel /a/ phonation for 2 second intervals ± 100 cent shift magnitude 200ms shift duration Presented 500-1000ms after voice onset 32 channel ERP recording Voice Auditory feedback of the voice Pitch shift during vocalization
DCM Model Specification • We used Bayesian model selection (BMS) family level inference to examine the following 2 factors in all three groups: • Factor 1: Effect of STG modulation across hemisphere • Factor 2: Effect of bilateral, left or right hemisphere modulation of connections • Significance of coupling parameters was also directly compared across all groups for all modulated connections of the bilateral family of models. • We identified a basic model, including modulated connections from STG to PM, PM to STG and STG to IFG in both hemispheres based on fMRI activation during vocalization
DCM Models Factor 1: Effect of STG modulation across hemisphere Right to Left Bilateral Left to Right Both hemispheres Factor 2: Effect of bilateral, left or right connections Left hemisphere Right hemisphere
ERP Responses Data were modeled between 1 and 200ms following the pitch-shift stimulus
Model Selection Results Factor 1 – Effect of STG modulation across hemisphere, no significant families identified for each groupalthough the AP group clearly favored models with modulated left to right STG connections
Model Selection Results Factor 2 – Effect of bilateral, left or right modulation of connections BMS indicated that modulation of STG connections to PM and IFG in both hemispheres is critical in the identification of self-voice pitch error in musicians with AP (0.92 random effects model exceedance probability) but not in the RP and NM groups (Figure 3).
Coupling Parameters Influence on coupling Negative coupling of left hemisphere PM to STG connections in AP and RP groups, compared to a positive coupling in the NM group was identified
Conclusions Musicians with enhanced pitch discriminating abilities likely have a “fine tuned” auditory error detection and correction system involving modulation of left to right STG connections. The role of the left hemisphere is radically different in musicians than in non-musicians. We identify reduced connectivity of left hemisphere PM to STG connections in AP and RP groups during the error detection and corrections process relative to non-musicians. This suppression may allow for enhanced connectivity relating to pitch identification in the right hemisphere in those with more precise pitch matching abilities Our findings here also suggest that individuals with AP are more adept at using feedback related to pitch from the right hemisphere.
Acknowledgments NIH 1R01DC006243 The Robin Lab Amy Parkinson, PhD Annie New Rachel Smallwood Rachel Hutson Michael Waskiewicz Aurora Robledo Collaborators Charles Larson, PhD Jeremy Greenlee, MD RoozbehBehroozmand, PhD Sona Patel, PhD