Download
1 / 40
450 likes | 613 Views
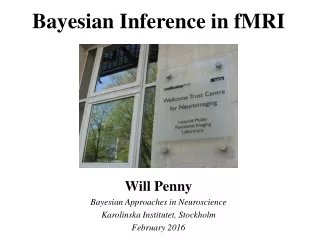
Bayesian models for fMRI data. Klaas Enno Stephan Translational Neuromodeling Unit (TNU) Institute for Biomedical Engineering, University of Zurich & ETH Zurich Laboratory for Social & Neural Systems Research (SNS), University of Zurich

E N D
Bayesian models for fMRI data Klaas Enno Stephan Translational Neuromodeling Unit (TNU)Institute for Biomedical Engineering, University of Zurich & ETH Zurich Laboratory for Social & Neural Systems Research (SNS), University of Zurich WellcomeTrust Centre for Neuroimaging, University College London With many thanks for slides & images to: FIL Methods group, particularly Guillaume Flandin The Reverend Thomas Bayes (1702-1761) Methods & models for fMRI data analysis November 2011
Why do I need to learn about Bayesian stats? Because SPM is getting more and more Bayesian: • Segmentation & spatial normalisation • Posterior probability maps (PPMs) • 1st level: specific spatial priors • 2nd level: global spatial priors • Dynamic Causal Modelling (DCM) • Bayesian Model Selection (BMS) • EEG: source reconstruction
Posterior probability maps (PPMs) Spatial priors on activation extent Bayesian segmentation and normalisation Dynamic Causal Modelling Image time-series Statistical parametric map (SPM) Design matrix Kernel Realignment Smoothing General linear model Gaussian field theory Statistical inference Normalisation p <0.05 Template Parameter estimates
Problems of classical (frequentist) statistics p-value: probability of getting the observed data in the effect’s absence. If small, reject null hypothesis that there is no effect. Probability of observing the data y, given no effect ( = 0). • Limitations: • One can never accept the null hypothesis • Given enough data, one can always demonstrate a significant effect • Correction for multiple comparisons necessary Solution: infer posterior probability of the effect Probability of the effect, given the observed data
Overview of topics • Bayes' rule • Bayesian update rules for Gaussian densities • Bayesian analyses in SPM • Segmentation & spatial normalisation • Posterior probability maps (PPMs) • 1st level: specific spatial priors • 2nd level: global spatial priors • Bayesian Model Selection (BMS)
Bayes‘ Theorem Posterior Likelihood Prior Evidence Reverend Thomas Bayes 1702 - 1761 “Bayes‘ Theorem describes, how an ideally rational person processes information." Wikipedia
Bayes’ Theorem Given data y and parameters , the conditional probabilities are: Eliminating p(y,) gives Bayes’ rule: Likelihood Prior Posterior Evidence
Bayesian statistics new data prior knowledge posterior likelihood ∙ prior Bayes theorem allows one to formally incorporate prior knowledge into computing statistical probabilities. Priors can be of different sorts:empirical, principled or shrinkage priors. The “posterior” probability of the parameters given the data is an optimal combination of prior knowledge and new data, weighted by their relative precision.
Principles of Bayesian inference • Formulation of a generative model likelihoodp(y|) prior distribution p() • Observation of data y • Update of beliefs based upon observations, given a prior state of knowledge
Posterior mean & variance of univariate Gaussians Likelihood & Prior Posterior Posterior: Likelihood Prior Posterior mean = variance-weighted combination of prior mean and data mean
Same thing – but expressed as precision weighting Likelihood & prior Posterior Posterior: Likelihood Prior Relative precision weighting
Same thing – but explicit hierarchical perspective Likelihood & Prior Posterior Posterior Likelihood Prior Relative precision weighting
Bayesian regression: univariate case Normal densities Univariate linear model Relative precision weighting
Bayesian GLM: multivariate case General Linear Model Normal densities 2 One step if Ce is known. Otherwise iterative estimation with EM. 1
Bayesian analyses in SPM8 • Segmentation & spatial normalisation • Posterior probability maps (PPMs) • 1st level: specific spatial priors • 2nd level: global spatial priors • Dynamic Causal Modelling (DCM) • Bayesian Model Selection (BMS) • EEG: source reconstruction
Squared distance between parameters and their expected values (regularisation) “Difference” between template and source image Spatial normalisation: Bayesian regularisation Deformations consist of a linear combination of smooth basis functions lowest frequencies of a 3D discrete cosine transform. • Find maximum a posteriori (MAP) estimates:simultaneously minimise • squared difference between template and source image • squared difference between parameters and their priors Deformation parameters MAP:
Spatial normalisation: overfitting Affine registration. (2 = 472.1) Without regularisation, the non-linear spatial normalisation can introduce unnecessary warps. Template image Non-linear registration without regularisation. (2 = 287.3) Non-linear registration using regularisation. (2 = 302.7)
Bayesian segmentation with empirical priors • Goal: for each voxel, compute probability that it belongs to a particular tissue type, given its intensity • Likelihood model: Intensities are modelled by a mixture of Gaussian distributions representing different tissue classes (e.g. GM, WM, CSF). • Priors are obtained from tissue probability maps (segmented images of 151 subjects). p (tissue|intensity) p (intensity|tissue) ∙ p (tissue) Ashburner & Friston 2005, NeuroImage
Bayesian fMRI analyses General Linear Model: with What are the priors? • In “classical” SPM, no priors (= “flat” priors) • Full Bayes: priors are predefined on a principled or empirical basis • Empirical Bayes: priors are estimated from the data, assuming a hierarchical generative model PPMs in SPM Parameters of one level = priors for distribution of parameters at lower level Parameters and hyperparameters at each level can be estimated using EM
Hierarchical models and Empirical Bayes Parametric Empirical Bayes (PEB) Hierarchical model EM = PEB = ReML Single-level model Restricted Maximum Likelihood (ReML)
Posterior Probability Maps (PPMs) Posterior distribution:probability of the effect given the data mean: size of effectprecision: variability Posterior probability map: images of the probability (confidence) that an activation exceeds some specified threshold, given the data y • Two thresholds: • activation threshold : percentage of whole brain mean signal (physiologically relevant size of effect) • probability that voxels must exceed to be displayed (e.g. 95%)
PPMs vs. SPMs PPMs Posterior Likelihood Prior SPMs Bayesian test: Classical t-test:
2nd level PPMs with global priors 1st level (GLM): 2nd level (shrinkage prior): Basic idea:use the variance of over voxels as prior variance of at any particular voxel. 2nd level:(2) = average effect over voxels, (2) = voxel-to-voxel variation. (1) reflects regionally specific effects assume that it sums to zero over all voxels shrinkage prior at the second level variance of this prior is implicitly estimated by estimating (2) 0 In the absence of evidence to the contrary, parameters will shrink to zero.
Shrinkage Priors Small & variable effect Large & variable effect Small but clear effect Large & clear effect
2nd level PPMs with global priors 1st level (GLM): voxel-specific 2nd level (shrinkage prior): global pooled estimate Once Cε and C are known, we can apply the usual rule for computing the posterior mean & covariance: • We are looking for the same effect over multiple voxels • Pooled estimation of Cover voxels Friston & Penny 2003, NeuroImage
PPMs and multiple comparisons No need to correct for multiple comparisons: Thresholding a PPM at 95% confidence: in every voxel, the posterior probability of an activation is 95%. At most, 5% of the voxels identified could have activations less than . Independent of the search volume, thresholding a PPM thus puts an upper bound on the false discovery rate.
PPMs vs.SPMs PPMs: Show activations greater than a given size SPMs: Show voxels with non-zero activations
PPMs: pros and cons Disadvantages Advantages • One can infer that a cause did not elicit a response • Inference is independent of search volume • SPMs conflate effect-size and effect-variability • Estimating priors over voxels is computationally demanding • Practical benefits are yet to be established • Thresholds other than zero require justification
1st level PPMs with local spatial priors • Neighbouring voxels often not independent • Spatial dependencies vary across the brain • But spatial smoothing in SPM is uniform • Matched filter theorem: SNR maximal when smoothing the data with a kernel which matches the smoothness of the true signal • Basic idea: estimate regional spatial dependencies from the data and use this as a prior in a PPM regionally specific smoothing markedly increased sensitivity Contrast map AR(1) map Penny et al. 2005, NeuroImage
The generative spatio-temporal model q1 q2 r2 r1 u1 u2 a b l A W observation noise autoregressive parameters regression coefficients = spatial precision of parameters = observation noise precision = precision of AR coefficients Y Y=XW+E Penny et al. 2005, NeuroImage
The spatial prior Prior for k-th parameter: Spatial precision: determines the amount of smoothness Shrinkage prior Spatial kernel matrix Different choices possible for spatial kernel matrix S. Currently used in SPM: Laplacian prior (same as in LORETA)
Example: application to event-related fMRI data Smoothing • Contrast maps for familiar vs. non-familiar faces, obtained with • smoothing • global spatial prior • Laplacian prior Global prior Laplacian Prior
Pitt & Miyung (2002), TICS Bayesian model selection (BMS) Given competing hypotheses on structure & functional mechanisms of a system, which model is the best? Which model represents thebest balance between model fit and model complexity? For which model m does p(y|m) become maximal?
Bayesian model selection (BMS) Bayes’ rules: Model evidence: accounts for both accuracy and complexity of the model allows for inference about structure (generalisability) of the model • Various approximations, e.g.: • negative free energy • AIC • BIC Model comparison via Bayes factor: Penny et al. (2004) NeuroImage
M3 attention M2 better than M1 PPC BF= 2966 stim V1 V5 M4 BF= 12 attention PPC M3 better than M2 stim V1 V5 BF= 23 M4 better than M3 Example: BMS of dynamic causal models attention M1 M2 modulation of back- ward or forward connection? PPC PPC attention stim V1 V5 stim V1 V5 additional driving effect of attention on PPC? bilinear or nonlinear modulation of forward connection? Stephan et al. (2008) NeuroImage