Download
1 / 21
210 likes | 405 Views
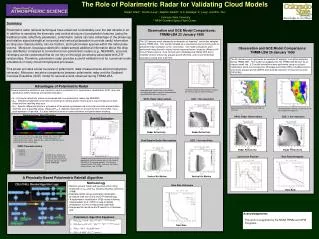
Spectral Processing for the polarimetric weather radar data with multiple processes in a resolution volume. Svetlana Bachmann. September 7, 2006. Seminar. Atmospheric Radar Research Center. wind. wind. birds. birds. Summary.

E N D
Spectral Processing for the polarimetric weather radar data with multiple processes in a resolution volume Svetlana Bachmann September 7, 2006 Seminar Atmospheric Radar Research Center
wind wind birds birds Summary Signal – polarimetric weather radar echoes in clear air Problem – wind velocity estimation during bird migration Basis – polarimetric spectral densities contain discernible signatures that allow recognition of the wind in multi-modal spectra. Approach – combination of non-parametric and parametric spectral analyses to retrieve wind insects
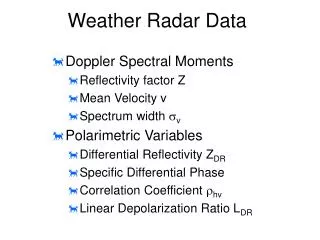
100 100 100 100 100 100 50 50 50 50 50 50 50 50 50 50 50 50 100 100 100 100 100 100 Problem Clear Air Case with Mixed Biological Scatterers Copolar correlation Differential phase Differential reflectivity Reflectivity in H and V channels Doppler velocity hv vh, m s–1 , degree Zh,dB ZDR,dB Zv,dB -30 -20 -10 0 10 20 30 0 0.2 0.4 0.6 0.8 1 180 90 0 -90 180 -10 0 10 20 -20 -10 0 10 20 30 Radar detects velocities exceeding 25 m s–1, while radiosonde measures wind below 15 m s–1. Inconsistency! Date – 09/07/2004 Time – 11pm CDT (4 UT) Radar – KOUN RRDA (Norman, OK) S-band (10-cm) dual-polarization PRT = 780s Ra= 117 km va = 35 m s–1 128 pulses 0.5 elevation Radiosonde
Q V I Range Weather signal sampling (2-pol Doppler weather radar) Range-Time Radial Ior Q Q = Im(V ) I = Re(V ) Pulse 1 2 3 PRT PRT M 1 range location Sample-Time Vertical pol: mean power, mean velocity, velocity dispersion; spectrum H-V (2-pol) differential reflectivity, copolar correlation, differential phase Horizontal pol: mean power, mean velocity, velocity dispersion; spectrum Echoes in one radial at an azimuth Repeat everything for the rest azimuths
-35 -30 -25 -20 -15 -10 -5 0 5 10 15 20 25 30 35 Velocity (m s–1 ) Power spectral density field in a radial -35 -30 -25 -20 -15 -10 -5 0 5 10 15 20 25 30 35 Velocity (m s–1 ) #1 #2 #3 Rmax Range Spectrum. Spectra in range. Ground Clutter Airborne Clutter Wind 0 1 . . . N–1 k va . . . -va Radial velocity Spectrum or PSD
Novel Spectral densities of polarimetric variables Sv(dB) Compute polarimetric variables for each Doppler velocity (spectral density) using spectral coefficients in H and V channels. Power-SD Sh(dB) Differential reflectivity ZDR Differential-reflectivity-SD ZDR(k) = 10 log10 sh(k)/sv(k) + Calibration ZDR Copolar correlation hv Copolar-correlation-SD hv Differential-phase-SD Differential phase (k) = arg[hv(k)] – SystemPhase (KOUN RRDA, 09/07/2004, 11pm CDT (04Z), el. 0.5, az.180)
Novel Censoring Power-SD Sh(dB) Differential-reflectivity-SD ZDR Copolar-correlation-SD hv Differential-phase-SD (KOUN RRDA, 09/07/2004, 11pm CDT (04Z), el. 0.5, az.180)
Assessing signal content SD in one radial (azimuth 180, elevation 0.5) Histograms (ranges from 30 to 70 km) Do you see 1 Gaussian? There are 2! Power-SD Polarimetric spectral densities have different values in the bands. The wind-band can be recognized. Sh(dB) Differential-reflectivity-SD The wind-band is wide. The increased spectral width might be caused by active insects (insects can add from 1 m s–1 to 5 m s–1 to the wind velocity) ZDR Copolar-correlation-SD hv Differential-phase-SD What is the wind velocity? (KOUN RRDA, 09/07/2004, 11pm CDT (04Z), el. 0.5, az.180)
wind birds Composite spectrum – speculations Migrating birds Active insects insects Wind Tracers (Passive insects Refractive index) Noise –va 0 va Radial velocity –va 0 va
Spectrum can be estimated many ways Non-parametric Parametric Subspace Methods The PSD is estimated directly from the signal itself, e.i. using FT. The signal is modeled and the PSD of the model is estimated. Methods are based on eigendecomposition of the correlation matrix. Periodogram, Welch, Multi taper (MTM) Multiple signal classification (MUSIC), eigenvector(EV), etc. Yule-Walker AR, Burg, modified covariance, etc. + Detection of sinusoids in noise, especially when the SNR are low. – The signal content must be known for proper modeling + Power is preserved – Window effect (broadening of spectrum) – Power is not preserved (complicated relations) – The spectrum width is hard to compute + Does not require large number of samples
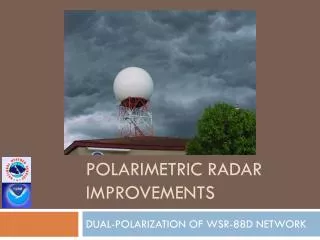
Which spectral estimate to choose? Non-parametric Parametric Modified covariance(3) EV(3) Periodogram MTM(3) MUSIC(3) Burg(3) Velocity, m s–1 Range, km
Which spectral estimate to choose? Non-parametric Parametric Modified covariance(3) EV(3) Periodogram MTM(3) MUSIC(3) Burg(3) Velocity, m s–1 Range, km 0 1 Normalized power
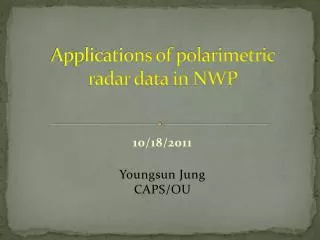
wind birds Choosing methods for PSD estimation Migrating birds Periodogram MUSIC(3) Velocity, m s–1 Velocity, m s–1 Active insects insects Wind Tracers (Passive insects Refractive index) Noise Range, km –va 0 va 0 1 Normalized power
Non- and parametric PSDs along range Zoom-in to 30 to 50 km Azimuth 180, elevation 0.5 Power (dB) Power (dB) wind/ insects Periodogram wind/ insects MuSiC(2) wind wind/ insects MuSiC(3) wind/ insects MuSiC(4)
Processing Technique Why using the combination of non- and parametric spectra? There are techniques for Ground Clutter Filtering and Noise Reduction of the radar echoes. These techniques are developed and tested for the non-parametric spectra. Ground Clutter Signal are generally strong and with a narrow spectral width. Therefore the AR models of small orders would model these unwanted signals first. Frequency Domain (3) rem. ground clutter (4) est. polarimetric spectral densities (5) est. # of types of scatterers (7) est. velocities of the # (8) est. corresponding to the types moments and polarimetric variables (9) censor unreliable returns Time Domain rem. DC from the time-series (1) est. non-parametric spectrum (2) est. parametric spectrum for a (6) process with # sinusoids in noise make radar products using (10) appropriate moments
Conclusions Non-parametric polarimetric spectral analyses of the weather radar echoes in clear air reveals simultaneous presence of migrating birds and insects mixed within radar resolution volume. The polarimetric signatures can identify the scatterer types (How many types? Birds, insects, weather or else?) The spectral density of parametric models provide the velocities of the scatterer types. Censored (black on radar displays) data contain information that can be retrieved using spectral analyses (non-parametric, parametric or combination).
Recall: Frequency-Domain Shamim Nematifar’s seminar Fractional Fourier Transform and Chirp Filtering F1 F2 F0 Time-Domain F3
Frequency-Domain DFrFT F1 F2 F0 Time-Domain F3 Power in V channel Power in H channel Time-Domain Frequency-Domain Coefficient 30 20 10 0 -10 -20 -30 Radial velocity Coefficient 30 20 10 0 -10 -20 -30 Radial velocity
DFrFT Power in V channel Power in H channel Time-Domain Frequency-Domain Coefficient 30 20 10 0 -10 -20 -30 Radial velocity Coefficient 30 20 10 0 -10 -20 -30 Radial velocity
DFrFT 70 km Power in V channel Power in H channel Time-Domain Frequency-Domain Coefficient 30 20 10 0 -10 -20 -30 Radial velocity Coefficient 30 20 10 0 -10 -20 -30 Radial velocity
Thank you! Questions?