Download
1 / 14
140 likes | 219 Views
Making a Line Plot. Collect data and put in chronological order. Ex. Scores on a math test 63 68 72 74 79 80 80 83 84 84 84 85 88 90 90 90 90 93 95 95 95 97. Determine a scale and intervals.

E N D
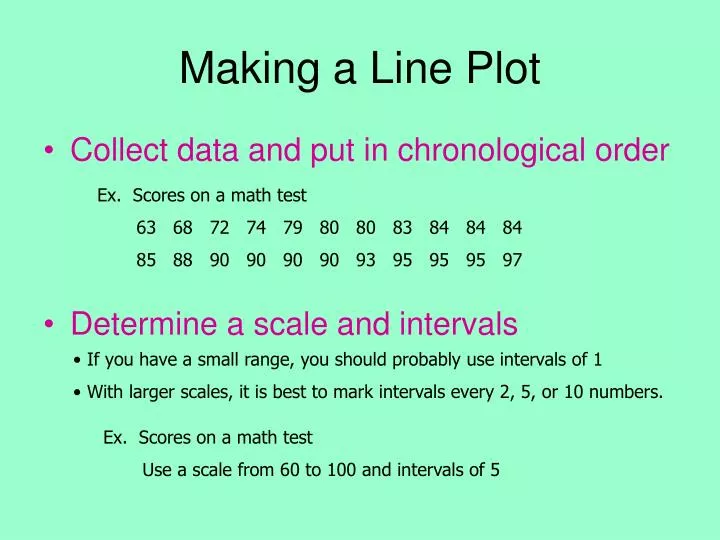
Making a Line Plot • Collect data and put in chronological order Ex. Scores on a math test 63 68 72 74 79 80 80 83 84 84 84 85 88 90 90 90 90 93 95 95 95 97 • Determine a scale and intervals • If you have a small range, you should probably use intervals of 1 • With larger scales, it is best to mark intervals every 2, 5, or 10 numbers. Ex. Scores on a math test Use a scale from 60 to 100 and intervals of 5
Making a Line Plot • Draw a horizontal line and mark the intervals Ex. Scores on a math test 63 68 72 74 79 80 80 83 84 84 84 85 88 90 90 90 90 93 95 95 95 97 60 65 70 75 80 85 90 95 100
Making a Line Plot • Mark an X above the number for each data point • If a number is repeated, place one X above the other Ex. Scores on a math test 63 68 72 74 79 80 80 83 84 84 84 85 88 90 90 90 90 93 95 95 95 97 X X X X X X X X X X X X X X X X X X X X X 60 65 70 75 80 85 90 95 100
Making a Line Plot • Count the number of data points and count the number of X’s to make sure you plotted each point! Ex. Scores on a math test 63 68 72 74 79 80 80 83 84 84 84 85 88 90 90 90 90 93 95 95 95 97 22 data points X 22 X’s X X X X X X X X X X X X X X X X X X X X 60 65 70 75 80 85 90 95 100
Reading a Line Plot • Understand the scale and interval Ex. This line plot has intervals of 2, so an X that falls between numbers would represent the median of those numbers. An X between the 6 and 8 would represent “7” X X X X X X X X X X X X X 0 2 4 6 8 10 12 14 16
Reading a Line PlotFinding the Minimum Minimum – smallest value • The minimum is the number represented by the first X The MINIMUM is 1 1 X X X X X X X X X X X X X 0 2 4 6 8 10 12 14 16 Do NOT just look at the numbers on the scale. The Minimum is NOT 0
Reading a Line PlotFinding the Maximum Maximum – greatest value • The maximum is the number represented by the last X The MAXIMUM is 15 X X 15 X X X X X X X X X X X 0 2 4 6 8 10 12 14 16 Do NOT just look at the numbers on the scale. The Maximum is NOT 16
Reading a Line PlotFinding the Range Range – difference between highest value and lowest value • Subtract the number represented by the first X from the number represented by the last X - = 14 The RANGE is 14 1 X X 15 X X X X X X X X X X X 0 2 4 6 8 10 12 14 16 Do NOT just look at the numbers on the scale. The Range is NOT 16 – 0 = 16
Reading a Line PlotFinding the Median Median – middle number when data is arranged in chronological order • Cross off the first and last X. Continue crossing off the first and last X’s until you reach the middle. The MEDIAN is 8 X X X X X X X X X X X X X 0 2 4 6 8 10 12 14 16
Reading a Line PlotFinding the Median Median – middle number when data is arranged in chronological order • If you get confused crossing off the X’s, list the numbers represented by the X’s in chronological order and cross them off. X X X X X X X X X X X X X 0 2 4 6 8 10 12 14 16 1 2 4 4 7 8 8 8 10 10 10 11 15
Reading a Line PlotFinding the Median Median – middle number when data is arranged in chronological order • If there are 2 numbers left in the middle, the median is the middle of those 2 numbers. The 2 middle numbers are 7 and 8, so the median is 7.5 X X X X X X X X X X X X 0 2 4 6 8 10 12 14 16
Reading a Line PlotFinding the Mode Mode = Most often X X X X X X X X X X X X 0 2 4 6 8 10 12 14 16
Reading a Line PlotFinding the Mean Mean – average • Add all the data points and divide by the total number of data points • Remember to include ALL the X’s The MEAN is 7.5 Continue for all data points 4 X X 1 2 4 7 X X X X X X X X X X X Add Them Up! Divide by the # of X’s 0 2 4 6 8 10 12 14 16 + + + + + 8 + 8 + 8 + 10 + 10 + 10 + 11 + 15 98 ÷ 13 ≈ 7.538 ≈ 7.5 13 X’s so divide by 13 Round if you get a long decimal