Download
1 / 33
330 likes | 395 Views
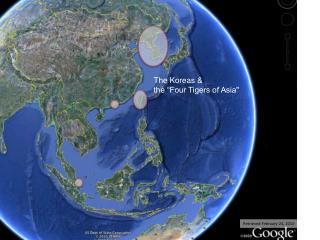
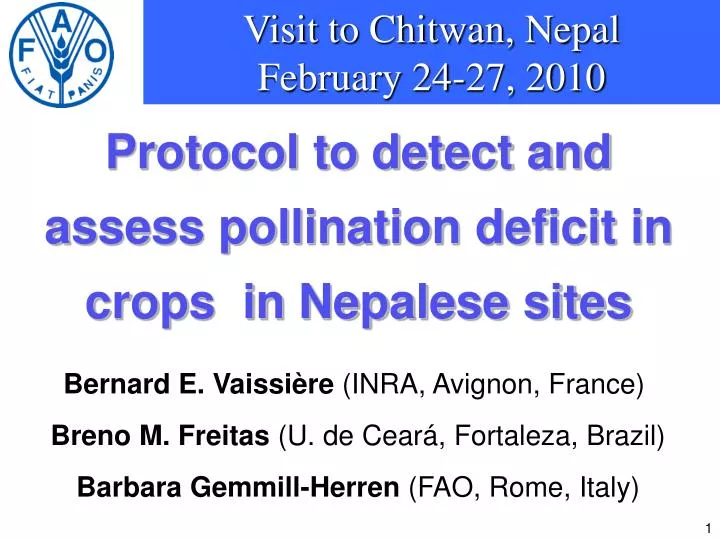
Visit to Chitwan, Nepal February 24-27, 2010. Protocol to detect and assess pollination deficit in crops in Nepalese sites. Bernard E. Vaissi ère (INRA, Avignon, France) Breno M. Freitas (U. de Cear á, Fortaleza, Brazil) Barbara Gemmill-Herren (FAO, Rome, Italy). 1.

E N D
Visit to Chitwan, Nepal February 24-27, 2010 Protocol to detect and assess pollination deficit in crops in Nepalese sites Bernard E. Vaissière (INRA, Avignon, France) Breno M. Freitas (U. de Ceará, Fortaleza, Brazil) Barbara Gemmill-Herren (FAO, Rome, Italy) 1
Background : How to detect and assess pollination deficit in crops ? 2008 : Literature review January - March => - Database: 67 publications that dealt with pollination deficit in crops - Preliminary draft of the review => Expert workshop in Avignon on April 3-6, 2008 2
Pollination deficit : definition and concept => Pollination deficit Based on Wilcock & Neiland (2002) who defined the concept of pollination failure Pollination deficit refers to quantitative or qualitative deficit of pollination which decreases the sexual reproductive output of plants • Other terminology • • Pollination limitation(used by Ashman et al. 2004, Knight et al. 2005) => refers to the absence of pollen deposition • Pollen limitation => refers to an inappropriate or insufficient deposition of pollen on the stigma 3
Working definition of pollination deficit in crops Crop pollination deficit refers to inadequate pollen receipt that limits agricultural output Inadequate pollen receipt • Quantitative • Qualitative (self-incompatible species) • Timing (effective pollination period / stigmatic receptivity) Limitation of agricultural output • Quantitative or qualitative • Productivity • Sustainability 4
Pollination deficit definition and concepts Optimum level Current level Pollination deficit => How to define and reach the optimum? 5
Methods to reach better or optimal pollination in crops Optimum pollination => Maximum output given the current available resources and taking into account the production objectives • • Yield / yield components [fruit set & seed set] • Fruit quality (size ; aspect) • • Seed quality (seed germination rate; oil content) • Earliness and uniformity of output • Market value / profitability • Environmental & societal impacts 6
Causes of pollination deficit Pollen production & viability Transport and deposition: Quantitative pollination:# of visits received / flower => Lack of visits (population effect) (yield of Coffea arabica increased with the introduction of Africanized honeybees in Central America ; Roubik 2002) • Qualitative pollination: quality, distribution, origin of pollen • - Lack of wild bees with high pollination effectiveness • Lack of wild bees for pPositive interaction with honey bees • Low pollinator biodiversity => lower and less stable • pollination 7
Methods to reach better or optimal pollination in crops Improved pollination ≈ Improved pollen transport, deposition & fertilization effectiveness (viability, compatibility) 8
Consensus methods to reach better or optimal crop pollination • Supplementation with honey bee colonies • (apple, buckwheat, cucurbits, mustard) Treatment : Introduce colonies of honey bees (Apis cerana and/or Apis mellifera) in or nearby the treated study fields at the onset of effective flowering (e.g. flowering of production trees in apple orchards) to increase density of honey bees on flowers of study fields while the control fields will not be provided with additional honey bee colonies 9
Supplementation with honey bees - 2 More realistic than hand pollination for most species Applicable in farmer production management Easy practice in many circumstances, even around houses for subsistence crops + • Pollination depends upon pollinator species introduced; • Limited to managed pollinators (Apis cerana or A. mellifera); • Unclear relationship between introduced bees and forager density; • Effect of pollinator addition is probably not additive in relation to existing pollinator population; • Possible negative effects of high pollinator densities (e.g. bumble bees) – 10
Supplementation with honey bees – 3 Experimental design 1. In homogeneous geographical area (≈ similar altitude and distance to semi-natural habitat), select ten fields : 5 fields with and 5 fields without colonies added (completely randomized design) or 2. Use the geographical area (for example the altitude) as blocking factor and select five pairs of fields, each subset of pairs in an homogeneous area, with one field with and one field without colonies added (randomized complete block design) or 3. In large fields > 450 m long away from one side where colonies can be introduced, select five such fields and test for a gradient of pollinator density from near to far from side with colonies (pollinator front) by recording data at 20, 220 and 420 m away from colonies 11 11
Supplementation with honey bees – 4 Special requirements • Record pollinator density & diversity just prior to colony introduction to know baseline situation, that is the abundance and diversity of the local pollinator population at onset of flowering; • Colonies should be introduced at night or late evening or very early morning so as to keep all their foraging force for their new location; • The stocking rate (number of introduced colonies per ha of target crop) should be based upon existing practices, but also take into account the area of flowering target crop without colony provided in the surroundings (as a rule of thumb, the smaller the study field, the higher the stocking rate should be and it is best not to go below the introduction of 2 colonies along any study field to compensate for the possible death of one colony following its introduction) • Minimum distance between adjacent fields should be ≥ flight distance of most pollinator species (≈ ≥ 2 km for honey bees); 11 12
Consensus methods to reach better or optimal crop pollination 2. Proximity to semi-natural habitats (large cardamom) Treatment : Use the landscape context, in particular the proximity of the treated fields to large patches (> 0.5 ha) of semi-natural habitats to increase pollinator abundance & biodiversity in the flowers of the study fields while control fields will be selected away from semi-natural habitats (≥ 500 m) Semi-natural habitat ≈ CORINE level 1 : forest, natural grassland, brush,… 13
Proximity to semi-natural habitats - 2 • Realistic variations of pollinator abundance & diversity • Contrasting situations can be achieved • Takes into account all the pollinator fauna, including species not commercially raised + • Potential correlated factors that affect yield components can confound results (e.g. fields along forest on steep slope may have inferior soil & overall agronomic conditions than faraway fields in the valley) • Requires landscape heterogeneity • Large changes in pollinator community possible from year to year – 14
Proximity to semi-natural habitats - 3 Experimental design 1. In homogeneous geographical area (≈ similar altitude and distance to semi-natural habitat), select ten fields : 5 fields adjacent to and 5 fields away from semi-natural habitats (completely randomized design) or 2. In mountainous areas, use the geographical area (e.g. the altitude) as blocking factor and select five pairs of fields overall, with each subset of pairs in an homogeneous area, and each field from a pair adjacent to and the other set afar from semi-natural habitats (randomized complete block design) or 3. In large fields > 450 m long away from side close to semi-natural habitats are available, select five such fields and test for a gradient of pollinator density and diversity by recording data at 20, 220 and 420 m away from side with semi-natural habitats (pollinator front) 15
Proximity to semi-natural habitats - 4 Special requirements • Area of semi-natural habitat adjacent to field should be as large as possible so as to provide as diverse and abundant a pollinator fauna as possible. For small bees, area ≥ 0.5 ha; for large bees => larger fragment; • Record distance to and type of closest semi-natural habitats for all fields; • If at all possible with GIS data available, determine proportion of semi -natural habitats around each study fields within a 1 km radius; • Minimum distance between adjacent fields should be ≥ flight distance of most pollinator species (≈ ≥ 2 km for honey bees); 16
Fixed-effect factors or independent variable (distance) • Presence or absence of nearby honey bee colonies; or • Close or far from semi-natural habitats; or • When gradient is possible, distance to pollinator front (introduced colonies or closest semi-natural habitat) 17
Possible blocking factors for experimental design with paired fields • Altitude (valley versus hill top ; e.g., mustard); • Distance to forest front (blocking factor if treatment is introduction of honey bee colonies ; e.g., apples); • Variety and planting pattern (e.g., apples with production and pollenizer varieties); • Village (e.g., possibly cucurbits) 18
Dependent variables to be recorded Forager density (forager/floral unit) • Pollinators/100 floral units (instantaneous counts) Forager diversity (species richness) • Pollinator catch on transects (with sweep nets) Pollinator activity should be recorded under good weather conditions for foraging : T ≥ 12°C, vegetation dry, light wind 19
Possible co-variables to be recorded • Flower density at each recording of pollinator activity ; • Temperature & relative humidity at each recording of pollinator activity ; • Schedule of pesticide applications in relation to flowering; 20
If size of study field permits (≥ 0.3 ha) => set experimental site of 50 m x 25 m aligned along rows if present row of crop 25 m 10 m minimum 70 m minimum 50 m 10 m minimum 45 m minimum 21
i [Plot to record the number of open flowers [in 1 m2 quadrant (buckwheat, mustard)] Layout to measure pollinator abundance & diversity when experimental site present [optional recordings in brackets] 25 m 3 50 Instantaneous count of potential pollinators (100 floral units scanned for pollinators in plot n°i) 4 2 4 j Net captures : Subunit n° j of a fixed transect consisting of six 25-m long subunits for insects capture over a 2-m width for 5 min in each sub-unit 34 3 50 m 2 17 1 5 1 0 6 0 5 10 15 20 25 22
i [Plot to record the number of open flowers [in 1 m2 quadrant (buckwheat, mustard)]. These quadrats are set at a fixe spot nearby the start of a subunit to record pollinator diversity For smaller fields or fields with special shapes, the experimental site is the whole field [optional recordings in brackets] 3 Instantaneous count of potential pollinators (100 floral units scanned for pollinators in plot n°i; these flowers can be recorded on the side of the field to avoid trempling ofthe crop 2 3 4 2 Net captures : Subunit n° j of a fixed transect consisting of six 25-m long subunits for insects capture over a 2-m width for 5 min in each sub-unit. If the perimeter of the field is < 150 m, it is OK to go back onto an area already sampled. j 5 1 1 4 6 23
For very large study fields, the experimental site is set half way between the center and the border d d 24
Experimental design The management of all experimental units is assumed to be as similar as possible except for the pollinator treatment Same variety ! 25
Dependent end variables Pollination treatments done on a plant-wide basis, that is with the whole plant as experimental unit Assessing agronomic & economic yield • Plants can compensate for pollen limitation with longer flowering periods, more flowers, etc... • Fruit set and/or seed set can be ressource-limited (Knight TM et al. 2005. Pollen limitation of plant reproduction: pattern and processes. Annu. Rev. Ecol. Evol. Syst. 36 :467-497) 26
Dependent variables Yield (agronomic terms : unit weight/unit area) • Straightforward (per plant or per plot) • Linked to commercial yield • Meaningful variable for farmers & consumers • Dependent of agronomic situation + • Long lag time until result • Between field variability can confound the link to pollination deficit (water availability; fertilizer; pest control) • Data access may be difficult (harvesting before the farmer) • Undeterminate crops may require repeated harvesting over the season – 27
Dependent variables Yield (monetary terms : market value) • Very context specific • May be very volatile • Lack of accepted methodology (interdisciplinary) • Link to pollination deficit may be tenuous & difficilut to establish • May be beyond the control of individual farmers – • Meaningful variable for farmers & consumers • Meaningful for government & policy makers • May assist farmers with proper documentation • Can include other currency of value for society (e.g., nutritional value) + 28
Experimental units Individual plant or tree (e.g., apple, mustard in mixed plantings, cucurbits) • Yield unit • Biological unit + • Considerable work if using hand pollination or if dependent variable is fruit/seed set with many flowers • Does not control for ressource allocation between years except if recorded over several years – 29
Experimental units Plot / field (e.g., buckwheat, cucurbit) • When individual plant not possible (buckwheat, rape) • Yield unit => talk to farmer • can be related to economic unit + • Does not control for ressource allocation between years except if recorded over several years (• Confound other inputs) – 30
Layout of the yield plots when experimental site present 25 m Yield plot (length of row – usually 2 m – or area of 1 m2 – as for buckwheat – or harvest individually 5 adjacent plants – as in mixed planting of mustard – or 2 trees adjacent and far away from pollenizer tree – as in apple) 50 4 34 3 50 m 2 i Instantaneous count of potential pollinators 17 Plot to record the number of open flowers 1 0 0 5 10 15 20 25 31
Layout of the yield plots in smaller fields or fields with special shape where the experimental site is the whole field L Yield plot (length of row – usually 2 m – or area of 1 m2 – as for buckwheat – or harvest individually 5 adjacent plants – as in mixed planting of mustard) 4L/5 4 3L/5 3 Length L 2 2L/5 Instantaneous count of potential pollinators 1 L/5 Plot to record the number of open flowers 0 0 l/5 2l/5 3l/5 4l/5 l width l 32
Summary of protocol to detect & assess pollination deficit in crops Method to expect better pollination • Supplement local pollinator population with honey bees • Proximity to semi-natural habitats Variables to record • Pollinator density (forager/floral unit at the right time) • Pollinator diversity (even in coarse categories) Experimental unit • field or plot or plant Final dependent variables • Agronomic yield & monetary yield 33