Download
1 / 14
140 likes | 307 Views
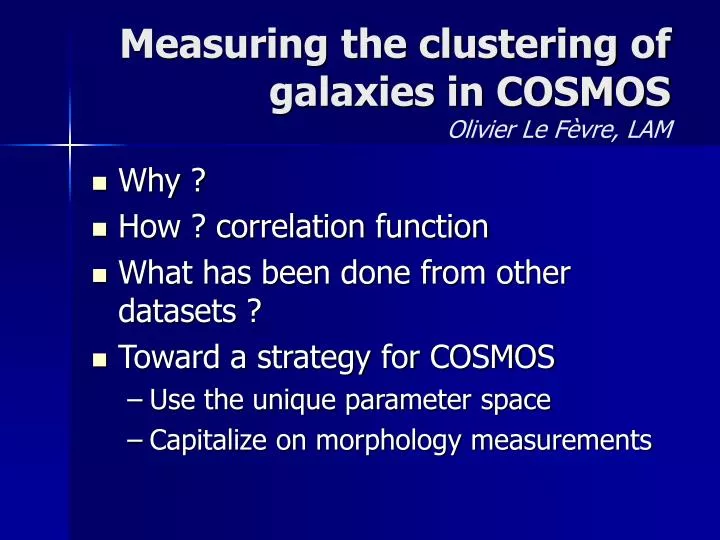
Measuring the clustering of galaxies in COSMOS Olivier Le Fèvre, LAM. Why ? How ? correlation function What has been done from other datasets ? Toward a strategy for COSMOS Use the unique parameter space Capitalize on morphology measurements. Clustering measurements: a unique tool.

E N D
Measuring the clustering of galaxies in COSMOSOlivier Le Fèvre, LAM • Why ? • How ? correlation function • What has been done from other datasets ? • Toward a strategy for COSMOS • Use the unique parameter space • Capitalize on morphology measurements
Clustering measurements: a unique tool • Characterize mass assembly over time • Clustering is progressing following the underlying cosmology frame • Probing scales from ~10kpc to ~10-20Mpc • Need large areas • Measure: • Correlation length r0 • =0.6/b • pair-wise velocity dispersion • Caveat: tracing clustering with luminous matter
COSMOS-Subaru, Guzzo et al. Standard method 2DFGRS • Compute 2-point correlation function (rp, ) and projection w(rp) • Higher order statistics: a powerful tool in COSMOS field
Constraints on COSMOS: what has been done before ? • COSMOS do not need to repeat previous experiments • Many other datasets with deep multi-wavelength and/or HST morphology information exist • Photo-z • Spectro-z • Wide fields / deep fields • No other single daset with same wide field, depth AND HST morphology
Current measurements: VVDS • VVDS-Deep • 9000 spectroscopic redshifts, IAB=24 • 0.7x0.7 deg², up to z~2
z=0.9 z=1.3 VVDS-0226-04 cone: Galaxy density field, 6217 redshifts IAB24 (C. Marinoni et al.) z=1.2 z=0.8 z=1.2 z=0.8 z=1.1 z=0.7 COSMOS will be 3x larger scales z=1.1 z=0.7 z=1 z=0.6 160Mpc 30Mpc z=0.6 z=1 z=0.9 z=0.5 2DFGRS/SDSS stop here
VVDS: measuring clustering evolution from z~2 Le Fèvre, Guzzo, et al., A&A, in press
Clustering length Full population Clustering length per galaxy type Evolution of galaxy bias Marinoni, et al., A&A, submitted
Strategy for clustering measurement with COSMOS • Unique to COSMOS: bringing together depth, morphology, and wavelength selection, over a large contiguous field • Compute (r,M(),type,z) • Photo-z • Spectro-z • Probe the evolution of different types of galaxy populations • Early types: when are they already in place in the densest environments ? • Star forming galaxies • Try to link populations in evolution scenario
key parameter at high-z: morphology • Select large morphology-selected sub-samples • assume 500-1000 galaxies for a proper calculation of wp • ACS-based ~3500A rest z~0.8: • ~800,000 images: 1600 bins (z,type,M) • NICMOS-based, ~1m rest: • ~20,000 images: 40 bins • Need to train machine on eye classification • Reference sample need to be defined for COSMOS
NICMOS tile H-band NICMOS images: a very important dataset • H band improves photo-z for z>1 • Compare ACS and NICMOS morphology measurements • Understand differences original GIM2D Model Mask Residual On-going work: Lidia Tasca et al. Paper for ApJ 1st release
Clustering analysis of COSMOS data for 1st ApJ release • Evolution of the correlation function per morphological type: • I band selected to z~1.2 • H band selected to z~1.5 • Photometric redshifts • Measurements at z~3-5 ? • Need iteration on photometric catalog On-going work: Baptiste Meneux et al. Paper for 1st ApJ release
Two-point correlation function • Select by • ACS morphology • early type • late type • irregulars • Select by • NICMOS morphology • early type • late type • irregulars • Select by apparent magnitude • I band • B band • H band • NUV (Galex) • Spitzer 3.6-8 microns Select by absolute magnitude / volume limited: UV to 1 m rest • I. Photo-z: down to I~26 • all galaxies selected from z~0 to z~1.2 • selected populations: LBGs z~3-5, EROs • II. Spectro-z: down to IAB~22.5 • all galaxies from z~0 to z~1.2 (zCOSMOS-bright) • all galaxies z~1.4-2.5 (zCOSMOS-deep)
Photo-z: comparing different methods Arnouts / Ilbert photo-z code Mobasher photo-z code On-going work: O. Ilbert, L. Tasca, S. Arnouts