Download
1 / 29
290 likes | 442 Views
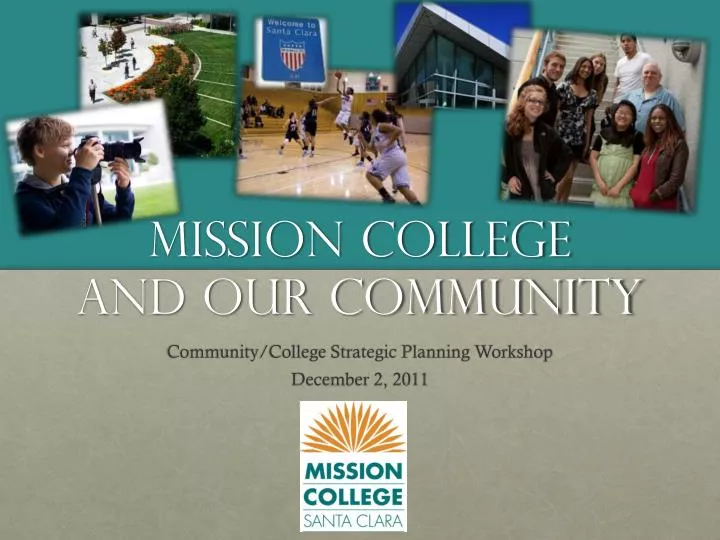
Mission College and our Community. Community/College Strategic Planning Workshop December 2, 2011. Today’s Community College. Open Access—practicing the ideal of education for all Offering flexibility in education Part-time students

E N D
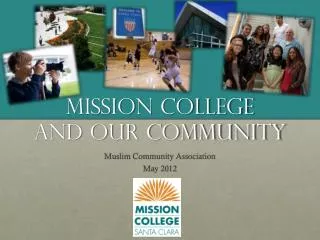
Mission College and our Community Community/College Strategic Planning Workshop December 2, 2011
Today’s Community College • Open Access—practicing the ideal of education for all • Offering flexibility in education • Part-time students • Evening, weekend and short-term courses, distance education • Educating Community Leaders • 80% of firefighters, law enforcement officers and EMTs are credentialed at community colleges • 70% of nurses in California received their education from community colleges • Transfer students from community colleges account for 48% of University of California’s bachelors degrees in science, technology, engineering, and math
Today’s California community Colleges • Largest system of higher education in the world • 112 community colleges across the state • Serve over two and a half million students each year (2,758,081 individual students in 2009-10) • The most affordable option for higher education Cost to Students: Undergraduate Fees, 2011-12
Today’s California community Colleges • Important Entry Point for Higher Education • 54% of CSU Graduates and 28% of UC Graduates in 2009-10 began their college years at a California Community College • Transfers in 2009-10 from CA Community Colleges • To University of California 14,690 • To California State University 37,651 • To In-State Private Colleges/Universities 23,584 • To Out of State Colleges/Universities 17,025
CCCsystem in Context Per-Student Funding by Education System, 2009-10 (amounts include state Gender Fund, local property tax, student fee revenue, and federal stimulus funding, but not STRS or lottery funds.)
Today’s Mission College • Founded in 1977 • Service area includes portions of Santa Clara and Santa Cruz Counties, with students from throughout Silicon Valley • Offers more than 70 academic, vocational and fundamental skills programs • Serves approximately 12,000 students each term • The Full Time Equivalent of 3,600 Students
Enrollment trends • Close to 65% of students come from outside the official college service area • Shift following the tech bubble swing in the early 2000s • Reduction in number of employed workers coming for specific tech-related skills • Increasing number of traditional students coming direct from High School • Traditionally known as an “evening school,” students now attend daytime classes in greater numbers than evening • Students in daytime classes made up 46% of students in Fall 2000, 63% in Fall 2010 • Distance Learning has increased by 20% in two years
Enrollment Trends • Student Headcount peaked in Spring of 2009 • Strong demand in last three years has been tempered by state mandated workload reductions
Student Focus • Of all Full Time Equivalent Students (FTES) in Spring 2011: • 13.6% came from Basic Skills (non-transferable) • 80.7% came from areas Transferable to 4-year colleges and universities • In addition, 29.5% of FTES generated would apply towards Vocational Education goals
Student demand • Top 5 Subjects by Enrollment 1. Mathematics 2. English as a Second Language 3. English 4. Wellness & Human Performance / Physical Education 5. Fire Protection Technology
About Our Students • Nearly 10% of students are new, first-time students while over 60% are returning from the prior term
About Our Students • Nearly 37% of students are enrolled at less than half-time status with only 25% enrolled as full-time students
Student characteristics • 57% Female, 42% Male (Spring 2011) • Diverse spread across age categories • 15% age 19 or younger, 14% age 50 or higher • 44% between the ages of 20 and 29
Race & Ethnicity • Richly diversestudent body • 77% of students with reported race/ethnicity are non-white
The City of Santa Clara • 39% foreign born • Nearly half speak English as a 2nd Language 81% Speak English “very well” English as a 2nd Language (51%) English (49%) 19% Speak English less than “very well” Source: U.S. Census Bureau, American Community Survey 2009
High School Success Rates • Only half of high school graduates are ready for a four-year college • The 4-Year Dropout Rate has improved to 11.9% from 16.1% in 2008-2009
High School Success Rates • Graduation and dropout rates vary significantly across groups
Today’s Environment • Tough! • But, getting better • Anticipated growth over the next twenty years • In population • In jobs • In median household income
Labor Market Information 1. Professional Scientific & Technical Services 3. Food Services & Drinking Places 4. Administrative & Support Services 2. Computer & Electronic Product Mfg. 5. Ambulatory Health Care Services Food Services & Drinking Places Ambulatory Health Care Services Professional Scientific & Technical Services Computer & Electronic Product Mfg. Admin. & Support Services Educati-onal Services Hospitals Merchant Wholesalers, Durable Goods Specialty Trade Contrac-tors Food & Beverage Stores Source: U.S. Census Bureau, Local Employment Dynamics
Industry growth Santa Clara County Industries with the Fastest Anticipated Growth, 2010 to 2019: • Information, 19% • Other services, 17% • Education and health services, 16% • Financial activities, 16% • Agriculture, natural resources, and mining, 16% • Overall growth, 10% Source: Economic Modeling Specialists, Inc. 2011
Occupation growth Santa Clara County Occupations with the Fastest Anticipated Growth, 2010 to 2019: • Professional and related occupations, 15% • Management, business, and financial occupations, 13% • Service occupations, 13% • Sales and related occupations, 9% Occupations with Anticipated Declines • Farming, fishing, and forestry occupations, -17% • Military occupations, -3% • Production occupations, -1% Source: Economic Modeling Specialists, Inc. 2011