Download
1 / 29
290 likes | 445 Views
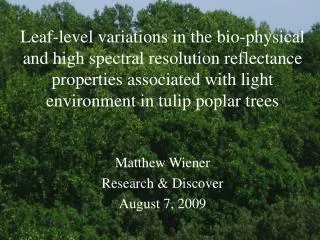
Development of a Hyperspectral Index for Detection of Initial Water Stress in Eastern Hemlock ( Tsuga canadensis ). Matthew Wiener Mawiener@vassar.edu Vassar College, Poughkeepsie, NY.

E N D
Development of a Hyperspectral Index for Detection of Initial Water Stress in Eastern Hemlock (Tsuga canadensis) Matthew Wiener Mawiener@vassar.edu Vassar College, Poughkeepsie, NY
Hemlocks across the Northeast are under biological attack from the Hemlock Woolly Adelgid (Adelges tsugae) (HWA). Ecosystem engineer: dark, cool forest, depauparate understory vegetation,winter habitats1,2, 3 HWA introduced in 1950s, Richmond VA3,4 Spreads 8-30 km per year - humans, birds, prevailing wind patterns3,4,5,6 Ecological Background • Two overlapping annual parthenogenetic generations - rapid population growth1,7,8 • Tree mortality can occur in as few as 4 years8
Pairs or ratios of wavelengths (spectral indices) can highlight specific biophysical vegetation features Multispectral tools (eg. LANDSAT) have emphasis on 4 to 6 broad wavebands but can mask sensitive portions of the spectrum11,12 Hyperspectral tools (eg. AVIRIS, HYPERION) offer finer spectral resolution11 Compared to remote detection, field-based investigation for detection of the HWA is useful but limited 4,9,10 Remote Sensing Background Multispectral Curve Hyperspectral Curve
Why water stress? • Hemlocks are particularly intolerant of drought conditions13 • Hemlock susceptibility/decline appears to be linked to environmental water stress1,4,7,14 • HWA feeds on storage parenchyma cells of the primary xylem 15,16 • Injection of toxic(?) saliva at feeding sites4,15 • May restrict xylem flow and cause leaf dehydration 1,3,16 • Current remote detection of HWA relies on equations that include • general water stress indices (eg. Pontius et al. 2005)
Methods • 2007 growth needles collected across Northeast. • Two experiments… 1) Needles dried at 65º C for 5 hrs. - Visible Infrared Intelligent Spectrometer (VIRIS) every 30 min. 2) Needles dried at 65º C for 1 hr. - VIRIS every 6 min. • Measured dry weight after each scan to determine percent water loss
Literature-Based Indices • Multispectral Indices • Thematic Mapper 5/4 (TM5/4): • Canopy water content17,18 • Normalized Difference Vegetation Index (NDVI): • Canopy structure, photosynthetic activity19 • Hyperspectral Indices • Water Balance R970/R900 (R970/R900): • Canopy water content20,21,22 • Red Edge Inflection Point (REIP) • Canopy chlorophyll content12,23
Results: One Hour Experiment NDVI TM5/4 r2=.735, p<.0001 Multispectral Indices r2=.701, p<.0001 REIP R970/R900 r2=.550, p<.0001 Hyperspectral Indices r2=.490, p<.0001
Results: Five Hour Experiment NDVI TM5/4 r2=.866, p<.0001 Multispectral Indices r2=.896, p<.0001 REIP R970/R900 r2=.660, p<.0001 Hyperspectral Indices r2=.850, p<.0001
Spectral Response to Water Stress • Shift of green peak to longer wavelengths • Formation of secondary (620 nm - 660 nm) and tertiary (530 nm - 540 nm) green peaks. • Created two indices relating these spectral features • Water Sensitive Band - 644nm • “Control Band” - 669 nm • Simple Ratio: R644/R669 • Normalized Difference: (R644-R669)/(R644+R669)
New Spectral Indices One Hour Five Hours Simple Ratio R644 R669 r2=.773, p<.0001 r2=.864, p<.0001 Normalized Difference R644-R669 R664+R669 r2=.801, p<.0001 r2=.899, p<.0001
Conclusions 1) New Standard Ratio and Normalized Difference Indices were more highly correlated with initialwater stress than any other index 2) Normalized Difference Index exhibited strongest correlation with water stress found in this experiment (5 hr. period) What is responsible for this spectral response to water loss? 3) Water stress decreases chlorophyll content, allows detection of xanthophyll and anthocyanin activities, which are usually masked.
Conclusions 1) New Standard Ratio and Normalized Difference Indices were more highly correlated with initialwater stress than any other index 2) Normalized Difference Index exhibited strongest correlation with water stress found in this experiment (5 hr. period) What is responsible for this spectral response to water loss? 650 nm - Chl-b 3) Water stress decreases chlorophyll content, allows detection of xanthophyll and anthocyanin activities, which are usually masked.
Conclusions 1) New Standard Ratio and Normalized Difference Indices were more highly correlated with initialwater stress than any other index 2) Normalized Difference Index exhibited strongest correlation with water stress found in this experiment (5 hr. period) What is responsible for this spectral response to water loss? 530 nm - Zeaxanthin 3) Water stress decreases chlorophyll content, allows detection of xanthophyll and anthocyanin activities, which are usually masked.
Conclusions 1) New Standard Ratio and Normalized Difference Indices were more highly correlated with initialwater stress than any other index 2) Normalized Difference Index exhibited strongest correlation with water stress found in this experiment (5 hr. period) What is responsible for this spectral response to water loss? 540 nm - Anthocyanin 3) Water stress decreases chlorophyll content, allows detection of xanthophyll and anthocyanin activities, which are usually masked.
Future Applications • Compared to general water stress indices (TM5/4, R970/R900) A highly sensitive hemlock specific initial stress index can allow… • Early remote detection (by AVIRIS, HYPERION) of hemlock stands that are currently under environmental water stress • May be more susceptible to infestation than stands in mesic locations • Detection of hemlock stands that are under initial stages of infestation • More accurate remote detection of landscape-scale decline • Preservation of an aesthetically and ecologically significant species!
Literature Cited 1) Orwig, D.A., Foster, D.R. 1998. Forest responses to the introduced hemlock woolly adelgid in southern New England, USA. Journal of the Torrey Botanical Society125: 60-73. 2) Evans, A.M., Gregoire, T.G. 2007. A geographically variable model of hemlock woolly adelgid spread. Biological Invasions9: 369-383. 3) Becker, D.A., Brittingham, M.C., Goguen, C.B. 2008. Effects of hemlock woolly adelgid on breeding birds at Fort Indiantown Gap, Pennsylvania. Northeastern Naturalist 15: 227-240. 4) Pontius, J., Hallett, R., Martin, M. 2005a. Using AVIRIS to assess hemlock abundance and early decline in the Catskills, New York. Remote Sensing of Environment97: 163-173. 5) Jenkins, J.C., Aber, J.D., Canham, C.D. 1999. Hemlock woolly adelgid impacts on community structure and N cycling rates in eastern hemlock forests. Canadian Journal of Forest Research 29: 630-645. 6) McClure, M.S., Cheah, C.A.S.-J. 1999. Reshaping the ecology of invading populations of hemlock woolly adelgid Adelges tsugae (Homoptera: Adelgidae), in eastern North America. Biological Invasions1: 247-254. 7) Koch, F.H., Cheshire, H.M., Devine, H.A. 2006. Landscape-scale prediction of hemlock woolly adelgid, Adelges tsugae (Homoptera: Adelgidae), infestation in the southern Appalachian mountains. Environmental Entomology35: 1313-1323. 8) McClure, M.S. 1995. Biology of Adelges tsugae and its potential for spread in the northeastern United States. In Proceedings of the First Hemlock Woolly Adelgid Review. pp 16-23. 9) Sampson, P.H., Mohammed, G.H., Zarco-Tejada, P.J., Miller, J.R., Noland, T.L., Irving, P.M., Colombo, S.J., Freemantle, J. 2000. The bioindicators of forest condition project: a physiological, remote sensing approach. Forestry Chronicle76: 941-952. 10) Pontius, J., Martin, M., Plourde, L., Hallet, R. 2005b. Using hyperspectral technologies to map hemlock decline: previsual decline assessment for early infestation detection. Third Symposium on Hemlock Woolly Adelgid in the Eastern United States. Pp. 87-100. Morgantown, WV. 11) Treitz, P.M, Howarth, P.J. 1999. Hyperspectral remote sensing for estimating biophysical parameters of forest ecosystems. Progress in Physical Geography23: 359-390. 12) Rock, B.N., Hoshizaki, T., Miller, J.R. 1988. Comparison of in situ airborne measurements of the blue shift associated with forest decline. Remote Sensing of Environment24: 109-127. 13) Onken, B.P. 1995. Long-term impact assessment of eastern hemlock forests. In Proceedings of the First Hemlock Woolly Adelgid Review, Charlottesville, VA. pp. 58-63. 14) Royle, D., Lathrop, R. 1999. The effects of site factors on the rate of hemlock decline: A case study in New Jersey. In Proceedings: Symposium on Sustainable Management of Hemlock Ecosystems in Eastern North America. pp. 103-104.
Literature Cited Continued… 15) Shields, K.S., Young, R.F., Berylyn, G.P. 1995. Hemlock woolly adelgid feeding mechanisms. In Proceedings of the First Hemlock Woolly Adelgid Review. Charlottesville, VA pp. 9-15. 16) Wallace, M.S., Hain, F.P. 2000. Field surveys and evaluation of native and established predators of the hemlock woolly adelgid {(Homoptera: Adelgidae) in the southeastern United States. Environmental Entomology 29: 638-644. 17) Hunt, Jr., E.R., Rock, B.N., Nobel, P.S. 1987. Measurement of Leaf Relative Water Content by Infrared Reflectance. Remote Sensing of Environment22: 429-435. 18) Hunt, Jr., E.R., Rock, B.N. 1989. Detection of changes in leaf water content using near- and middle-infrared reflectances. Remote Sensing of Environment30: 43-54. 19) Myneni, R.B., Hall, F.G., Sellers, P.J., Marshak, A.L. 1995. The interpretation of spectral vegetation indexes. IEEE Transactions on Geoscience and Remote Sensing33: 481-486. 20) Carter, G.A. 1993. Responses of leaf spectral reflectance to plant stress. American Journal of Botany80: 239-243. 21) Penuelas et al. (1995) Peñuelas, J., Filella, I., Gamon, J.A. 1995. Assessment of photosynthetic radiation-use efficiency with spectral reflectance. New Phytologist 131: 291-296. 22) Tucker, C.J. 1980. Remote sensing of leaf water content in the near infrared. Remote Sensing of Environment10: 23-32. 23) Vogelmann, J.E., Rock, B.N., Moss, D.M. 1993. Red edge spectral measurements from sugar maple leaves. International Journal of Remote Sensing14: 1563-1575. 24) Alberte, R.S., Thornber, J.P. 1977. Water stress effects on the content and organization of chlorophyll in mesophyll and bundle sheath chloroplasts of maize. Plant Physiology59: 351-353. 25) Sims, D.A., Gamon, J.A. 2002. Relationships between leaf pigment content and spectral reflectance across a wide range of species, leaf structures and developmental stages. Remote Sensing of Environment 81: 337-354. 26) Blackburn, G.A. 1998. Quantifying chlorophylls and carotenoids at leaf and canopy scales: An evaluation of some hyperspectral approaches. Remote Sensing of Environment 66: 273-285. 27) Lichtenthaler, H.K. 1987. Chloroplasts and carotenids: pigments of photosynthetic membranes. Methods in Enzymology148: 350-382. 28) Verhoeven, A.S., Adams, W.W., Demmig-Adams, B., Croce, R., Bassi, R. 1999. Xanthophyll cycle pigment localization and dynamics during exposure to lower tempatures and light stress in Vinca major. Plant Physiology120: 727-737. 29) Demmig, B., Winter, K., Krüger, A., Czygan, F-C. 1988. Zeaxanthin and the heat dissipation of excess light energy in Nerium oleander exposed to a combination of high light and water stress. Plant Physiology87: 17-24. 30) Gitelson, A.A., Merzlyak, M.N. 2004. Non-destructive assessment of chlorophyll, carotenoid, and anthocyanin content in higher plant leaves: Principals and algorithms. Remote Sensing for Agriculture and the Environment. (S. Stamatiadis, J.M. Lynch, J.S. Schepers Eds.). Greece, Ella, 2004, 78-94.