Download
1 / 24
240 likes | 592 Views
Sprawl and Fragmentation: How Much Development Deters Native Bird Species? Mary Ann Cunningham, Jake Hoffman Vassar College Built Tax Parcels Dutchess County NY 1940 1970 2004 Questions: 1. Are native, woodland bird species inhibited by urbanization on the urban fringe?

E N D
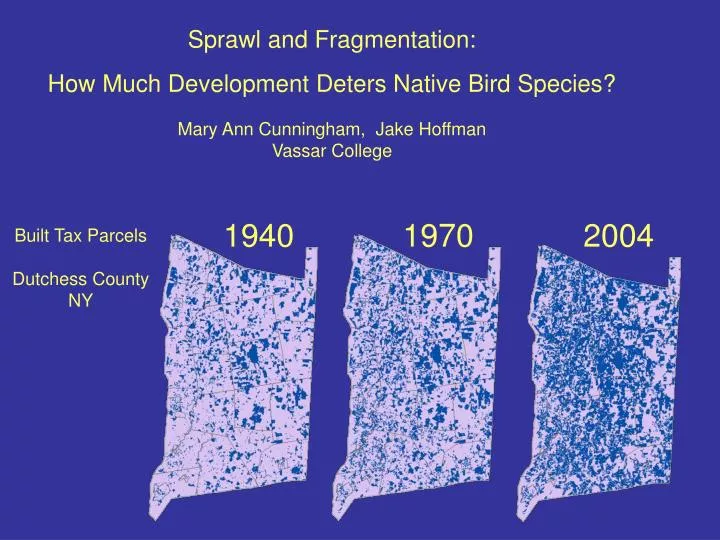
Sprawl and Fragmentation: How Much Development Deters Native Bird Species?Mary Ann Cunningham, Jake Hoffman Vassar College Built Tax Parcels Dutchess County NY 1940 1970 2004
Questions: 1. Are native, woodland bird species inhibited by urbanization on the urban fringe? 2. Which gradients of urbanization are most important in predicting these species? (road density, tree cover, built density, proximate conditions) 3. Can easily-calculated measures, e.g. focal statistics, support multiple-scale investigations? (as alternative to digitizing/interpreting landcover data)
Study Area Poughkeepsie, NY Study area approx 14 x 6 km (85 km2)
Methods: Point counts (5 min, 100 m radius) Distributed at 500 m intervals on E-W transects Explanatory variables: Proximate habitat: % cover (grass, shrub, trees, pavement); feeder (p/a), tree hights Calculated %road area (moving window/focal statistics over study area)
Average built parcel size ( built density) Interpolated surface from tax parcel centroids using parcel size as value (natural neighbor interpolation)
Digitized Tree cover %trees at 4 scales 300 m 600 m 900 m 1200 m
Results: Bird counts: 84 observations 34 species, using P/A measures, most < 10 occurrences
Results: Bird counts: 84 observations 34 species, using P/A measures, most < 10 occurrences ANOVA: indicates difference in variable value between presence and absence observations
Significant Results (small sample sizes make results provisional!) (using Chi2 or backwards anova)
Significant Results (small sample sizes make results provisional!) (using Chi2 or backwards anova)
Ubiquitous species
Christmas Bird Count results Number in 2004
Conclusions: 1. Native species, woodland species show relatively little effect on the range of urbanization gradients in the study area Urban species, including invasives, show relatively large effects ----------- 2. Percentage road area = easy to calculate, useful factor Distance = not useful in suburban contexts (gradients too small) Parcel size = easy to calculate but less useful than road area All of these are easier to assess accurately than LULC or digitized tree cover. BUT tree cover is still generally more influential ----------- 3. Despite small samples, trends were consistent over scales Focal statistics is a useful, easy approach to multiple-scale studies