Download
1 / 45
450 likes | 690 Views
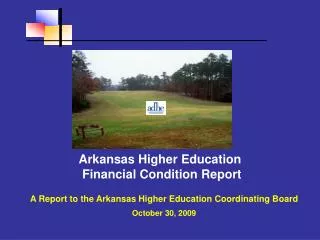
Arkansas Higher Education Financial Condition Report. A Report to the Arkansas Higher Education Coordinating Board October 30, 2009. Declining Purchasing Power of State Funding (an Update). $2,207. per student. 34% decline. $1,290. $1,453. $1,322.

E N D
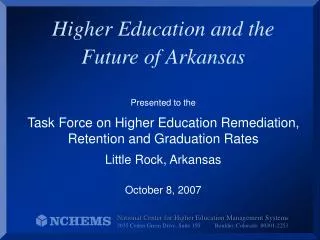
Arkansas Higher Education Financial Condition Report A Report to the Arkansas Higher Education Coordinating Board October 30, 2009
$2,207 per student 34% decline $1,290 $1,453 $1,322
Significant Enrollment increases while . . . State support declines Students expect and demand greater amenities
Includes $9,350,000 in Tobacco Tax Funds for Trauma Centers Without Trauma Center Funds the loss would be (-$23,758,740)
Pay Plan Implementation Cost did not take into consideration employees not paid through E&G. Did not include the auxiliary staff costs. Did not include Faculty and non- classified staff.
Median annual tuition and required fees reached $5,000 in SREB states in 2008. This was 74 percent more than in 1998 after adjusting for inflation. In Arkansas, tuition and fees were 5,700 — an increase of 103 percent from 1998.
Median annual tuition and required fees were about $2,100 for the SREB region in 2008. This was 45 percent more than in 1998 after adjusting for inflation. In Arkansas, tuition and fees were 2,000 — an increase of 62 percent from 1998.
Women Men
The Use of Part-Time Faculty and Graduate Assistant to Teach
Interim Legislative Study of Higher Education • Three “Musts”: • We must make sure state government continues to do its part in funding higher education • We must limit the start up of new programs • We must ensure a net reduction in costs for students
A New Look at Measuring PerformanceA Proposed Methodology by the Delta Cost Project
Source: Delta Cost Project: “The dreaded “P” word” July 2009 Arkansas is only one completion per 100 FTE below the National Average
State Funds plus Tuition & Fee Income US Average Total Funds = State Funds + Tuition & Fees Arkansas is one of the 10 lowest states in total funds per FTE Source: Delta Cost project “the dreaded “P” word Source: Delta Cost Project: “The dreaded “P” word” July 2009
2007-08 X = Source: Delta Cost Project: “The dreaded “P” word” July 2009
Most Arkansas is Among the Top 20 States in Productivity Productivity Source: Delta Cost Project: “The dreaded “P” word” July 2009 Least
Arkansas Higher Education’s Financial Condition in Perspective
Educational appropriations per FTE (defined to include state and local support for general higher education operations) fell to $6,571 in 2005 (2009 dollars), a 25-year low in inflation-adjusted terms. • Between 2005 and 2008 educational appropriations per FTE recovered, growing to $7,221 in 2008, but dropped 4.0% to $6,934 in 2009
Partially offsetting decreased state and local support, constant dollar net tuition per FTE increased by 1.8 percent between 2008 and 2009 • Over the last 25 years, the share of total educational revenues derived from tuition increased over 10 percentage points from approximately 24 percent to a high of 37.3 percent in 2009
Per FTE total educational appropriations increased in more than half of the states between 2004 and 2009, but the variation is wide. Across all 50 states, the change in educational appropriations per FTE varied from -29.1 percent to +37.0 percent.
Educational appropriations per FTE (see the blue bars in Figure 3) reached a high of $7,962 in 2001. • Following four years of decline (2002, 2003, 2004, and 2005), per student educational appropriations increased in 2006, 2007, and 2008, recovering to $7,221 and then declining once again to $6,934 in 2009. • Appropriations per FTE remained lower in 2009 (in constant dollars) than in most years since 1980.
Will such public commitment return following the recession that began in 2008, and if so, to what level? • According to the National Association of State Budget Officers, state revenues have fallen at an unprecedented rate and full recovery will, at best, take many years. This prognosis, combined with the depletion of ARRA state fiscal stabilization funds, suggests that 2011 is likely to be a very challenging budget year in many states
"How much funding is enough?" • Educators and policymakers must work together to address such key questions as: - What kind of higher education system do we want? - What will it take, given our circumstances, to obtain and sustain such a system? - Are we making effective use of our current investments? - What can we afford to invest in order to meet our goals? Good financial data and analysis are clearly essential for addressing such questions.