Download
1 / 21
210 likes | 262 Views
LBBD Demographics and Child Poverty. Population Growth in LBBD. Rapid population growth; real term increase of 29% in 0-17 year olds in LBBD in last 10 years – significantly higher than London (and nationally). Population Growth 0-4.

E N D
Population Growth in LBBD • Rapid population growth; real term increase of 29% in 0-17 year olds in LBBD in last 10 years – significantly higher than London (and nationally)
Population Growth 0-4 • 54% increase in the last 10 years in 0-4 year olds – significantly higher than London
Measuring Child Poverty- Official Child poverty is *currently measured primarily by household income. Households are classified as poor if income is below 60% of median (average) household income before housing costs This equates to: • £301 per week for a lone parent with two children (aged 5 & 14). • £384 per week for a couple with two children (aged 5 & 14).
Latest London Poverty Profile 2013 • Compiled by New Policy Institute (Npi) for Trust for London, the largest independent charitable foundation funding work which tackles poverty in London • 2013 report was the 4th report in a series begun in 2008 allowing comparison over time • Data is from a range of official sources • Next slide shows changes since 2011
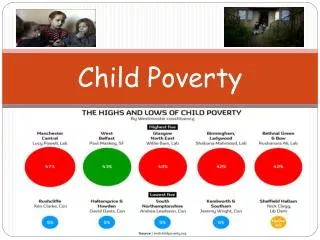
Child Poverty in London by ward Source End Child Poverty 2012 mid year estimates
Mortgage Repossession orders Source: Ministry of Justice English Housing Survey
Landlord Repossession Orders Source: Ministry of Justice/ English Housing Survey
BandD Together • We build relationships, co-ordinate activities that people of the borough are leading and share skills or resources ensuring Barking and Dagenham is a great place to live. • When the BanD Together symbol is used, it indicates an opportunity for people to receive or give support as needed. This is one of many initiatives across the borough to make life better for local people.
Strands • Strengthening communication and engagement • Meeting immediate need • Developing sustainable solutions through community empowerment
How can you help? Promote, use and participate in… • Food collection from civic buildings (blue boxes) • Warmer homes project • Money Matters courses at Children’s centres • Community connect online information tool
Any questions? Mark Adams Strategic Data Manager l 14-19 Education, Employment and Training and Child Poverty Lead London Borough of Barking and Dagenham The Foyer, Streetbase Advice Suite, 50 Wakering Road, Barking| IG11 8DG Phone: 020 8724 3239 |