Download
1 / 60
600 likes | 739 Views
Jonathan Bradshaw. Research on child poverty and child well-being. The Queen’s University Belfast 9 April 2008. Outline:. Tour of my research on the subject over the last decade It has moved from UK research on child income poverty To comparative research on child income poverty

E N D
Jonathan Bradshaw Research on child poverty and child well-being The Queen’s University Belfast 9 April 2008
Outline: • Tour of my research on the subject over the last decade • It has moved from • UK research on child income poverty • To comparative research on child income poverty • To UK research on overlaps - more than one indicator • To comparative research on overlaps • To UK research on child wellbeing and spatial • To comparative research on child well-being • Northern Ireland
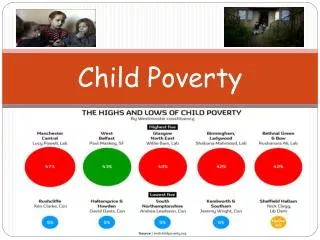
Child poverty:1979-1995/660 per cent equivalent household income
Euro-mean Child poverty rates 199560% of the national equivalised median income.
End of child poverty • Prime Minister’s pledge: “Our historic aim, that ours is the first generation to end child poverty forever….It’s a 20 year mission but I believe it can be done”
Comparative background: • The child has been absent from EU – lack of “competence” under Treaties • Lisbon summit introduces social inclusion – and enables the child to come in • Social inclusion strategy monitored by “Laeken” indicators – only two on children • % children living in workless families • Relative child poverty rates
% children 0-17 living in workless households 2006. (Eurostat 2007)
Child poverty rate (less than 60 per cent of the median 2005 (Eurostat)
What is wrong with income poverty? • Income • Is not easy to measure • Is not a good measure of command over resources – ignores dissaving, borrowing and domestic consumption • Relative thresholds very different in different countries (including NI)
What is wrong with income poverty? • Income not easy to measure • Not a good measure of command over resources • Relative threshold very different in different countries • 60 per cent of median arbitrary • Modified OECD equivalence scale has no basis in science • Poverty rates hide poverty gaps and poverty persistence
Overlaps analysis • Began in Ireland • Now in FRS • Coming in EU SILC • Have used it in • MCS • BHPS • SASAS • Bulgaria • Georgia
Monitoring child well-being in the UK • Poverty the outcomesfor children (FPSC 2001) • Child well-being in the UK, Save the Children (2002) • Child well-being in the UK, Save the Children (2005)
Child demography Child poverty and deprivation Child health Child lifestyles Mental health and well-being Child’s time and space Child maltreatment NORTHERN IRELAND In and leaving care Childcare Crime and illegal drug use Education Housing and neighbourhoods Chapters
Every Child Matters: Outcomes framework • Economic well-being: having sufficient income and material comfort to be able to take advantage of opportunities. • Being healthy: enjoying good physical and mental health and living a healthy lifestyle. • Staying safe: being protected from harm and neglect and growing up able to look after themselves. • Enjoying and achieving: getting the most out of life and developing broad skills for adulthood. • Making a positive contribution: developing the skills and attitudes to contribute to the society in which they live. • Input orientated – not operationalised
More background: • At Luxembourg Presidency of EU: Atkinson Report recommends “child mainstreaming” and development of child well-being indicators • EUROSTAT cautious and reluctant • Suggestion that one extra indicator on educational attainment might be added to Laeken set • So for UK Presidency we develop of an index of child well-being based on existing comparative data sources • (Bradshaw, J., Hoelscher, P. and Richardson, D. (2007) An index of child well-being in the European Union 25, Journal of Social Indicators Research, 80, 133-177.) • Later produce others for • OECD for UNICEF • CEE/CIS for UNICEF
Conceptualisation of child well-being • Multi-dimensional approach • Based on children’s rights as outlined in the UN CRC • Ideology • Child the unit of analysis • What children think and feel is important • Well-being more important than well-becoming • Outcomes rather than inputs • Direct measures rather than indirect measures
Data Sources I: Surveys • Health Behaviour of School Aged Children (HBSC) 36 countries at 2001 • Programme for International Student Assessment (PISA) 32 countries at 2000, 41 at 2003 • Citizenship and Education Survey (CIVED) 28 countries at 1999 and EUYOUPART (2005) • European School Survey Project on Alcohol and other Drugs (ESPAD) 26 countries at 2003 • European Quality of Life Survey (EQLS) 28 countries at 2003
Data Sources II: Series • WHO mortality data base 1993-1999, all countries except DK & CY • World Bank World Development Indicators 2003, all countries • OECD (2004) Education at a Glance, 2002 data • Eurostat (2003) Population and Social Conditions • Eurostat (2004) Labour Force Survey • World Bank (2002) Health, Nutrition and Population Data
Material situation • Relative child income poverty • Child poverty rate • Child poverty gaps • Child deprivation • Lacking car, own bedroom, holidays last year, a computer • Lacking a desk, quiet for study, a computer, calculator, dictionary, text books • Less than ten books in the home • Parental worklessness
Subjective Well-being • Personal well-being • Young people with scores above the middle of a life satisfaction scale 11, 13 and 15 years (%) - HBSC 2001/02 • Students who agree or strongly agree to 'I feel like an outsider (or left out of things)', 15 years (%) - PISA 2003 • Students who agree or strongly agree to 'I feel awkward and out of place', 15 years (%) - PISA 2003 • Students who agree or strongly agree to 'I feel lonely', 15 years (%) - PISA 2003 • Well-being at school • Young people feeling pressured by schoolwork 11, 13 and 15 years (%) - HBSC 2001/02 • Young people liking school a lot 11, 13 and 15 years (%) - HBSC 2001/02 • Self defined health • Young people rating their health as fair or poor 11, 13 and 15 years (%) - HBSC 2001/02
Children’s relationships • Quality of family relations • Students whose parents eat the main meal with them around a table several times a week, 15 years (%) - PISA 2000 • Students whose parents spend time just talking to them several times a week, 15 years (%) - PISA 2000 • Family structure • Young people living in 'single parent' family structures 11, 13 and 15 years (%) - HBSC 2001/02 • Young people living in 'Stepfamily' family structures 11, 13 and 15 years (%) - HBSC 2001/02 • Peer relationships • Young people finding their peers kind and helpful 11, 13 and 15 years (%) - HBSC 2001/02
Overall child well-being and % of young people saying they lived in a lone parent or step parent family r=0.13(ns)
Health • Health at birth • Infant mortality rates (WDI 2003) • Low birth weight (OECD Health Data) • Immunisation • Measles WDI (2003) • DPT3 WDI HNP (2002) • Pol3 WDI HNP (2002) • Health behaviour • Brushing teeth (HBSC) • Eating fruit every day (HBSC) • Eating breakfast before school (HBSC) • Physical activity (HBSC) • Obesity and pre obesity (HBSC)
Risk and Safety • Risk & Safety • Young people who were involved in physical fighting at least once in the previous 12 months 11, 13 and 15 years (%) - HBSC 2001/02 • Young people who were bullied at least once in the previous couple of months 11, 13 and 15 years (%) - HBSC 2001/02 • Child deaths • All child deaths: All under 19 deaths per 100,000 children, WHO mortality database, 3 year averages, MRD • Risk behaviour • Teenage pregnancy (adolescent fertility rate), adolescent fertility rate, births per 1000 women 15-19 - WDI, 2003. • Young people who have had sexual intercourse, 15 years (%) - HBSC 2001/02 • Young people who used a condom during their last sexual intercourse, 15-year-olds (%) - HBSC 2001/02 • Cigarette smoking: Lifetime use 40 times or more 16 years (%) - ESPAD, 2003 • Drunkenness: Lifetime 20 times or more 16 years (%) - ESPAD, 2003 • Cannabis: Experience of use in Lifetime 16 years (%) - ESPAD, 2003 • Inhalants: Experience of use in Lifetime 16 years (%) - ESPAD, 2003
Education • Achievement • Reading literacy achievement, 15 years - PISA, 2003 • Mathematics literacy achievement, 15 years - PISA, 2003 • Science literacy achievement, 15 years - PISA, 2003 • Participation • Full-time and part-time students in public and private institutions, by age: 15-19 as a percentage of the population of 15 to 19-year-olds (2003) LU SK (2002) • Early Years Participation - children in registered childcare (% of children aged 0-2) - OECD, MRD • Aspirations • Percentage of the youth population not in education, not in the labour force or unemployed - age 15-19 - OECD, 2003 • Proportion of pupils aspiring to low skill work, 15 years - PISA, 2000
Child well-being and educational attainment r = 0.39 (ns)
Civic and political participation • Civic participation • Participation rates: young people reporting involvement in two of five social participations 14 years (%) (Eng for UK, French BE) - CivEd. 1999 • Interest in politics • Political interest: young people reporting above the median involvement in political behaviours 14 years (%) (Eng for UK, French BE) - CivEd. 1999
Housing and environment • Overcrowding • Rooms per person in households with children (under 16’s) - EQLS, 2003 • Environment • Households with children who think it is unsafe or very unsafe to walk around in their area at night (under 16’s) - EQLS, 2003 • Households with children reporting many physical environment problems (under 16’s) - EQLS, 2003 • Housing problems • Households with children reporting at least two household problems (under 16’s) - EQLS, 2003
Search for a summary measure • Material well-being is better than child poverty • Different domains have varying relationship to child well-being
Search for a summary measure • Material well-being is better than child poverty • Different domains have varying relationship to child well-being • What about single indicators?
Child well-being and teenage fertility rate R = 0.88***
Search for a summary measure • Material well-being is better than child poverty • Different domains have varying relationship to child well-being • What about single indicators? • What about selected indicators representing domains
Single indicators with highest correlation with cluster score
Criticisms • Data driven • Countries without some or all indicators • Some well-being domains not represented • Focus on older children • Out of date • Summarising indicators • Z scores implied weights • No weights • Limited direct access to sample data • Cumulating % without regard to confidence intervals • No measures of dispersion • Validity and reliability
Discussion • Our index first attempt • Academic - probably too complex • Explored scope for a simpler index • Domains more important than overall ranking • They get closer to why questions and thus policy