Download
1 / 11
110 likes | 117 Views
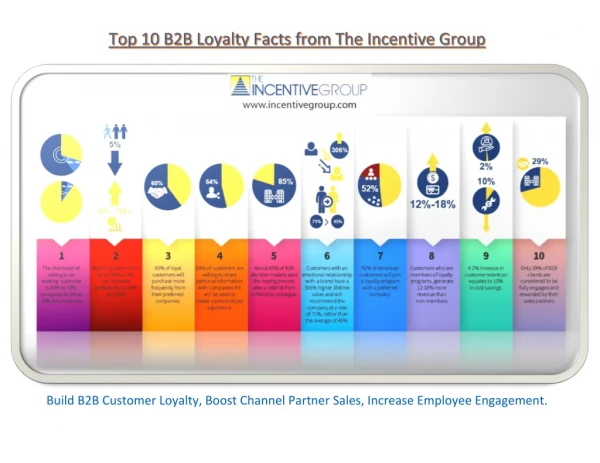
Forum for People Performance Management and Measurement - Hotel Study - The Incentive Group<br>http://www.incentivegroup.com -<br>The Incentive Group is a leading loyalty agency made up of experienced practitioners. The TIG team specializes in B2B loyalty programs, providing employee engagement, corporate gifts, sales, travel and channel incentives, and much more.

E N D
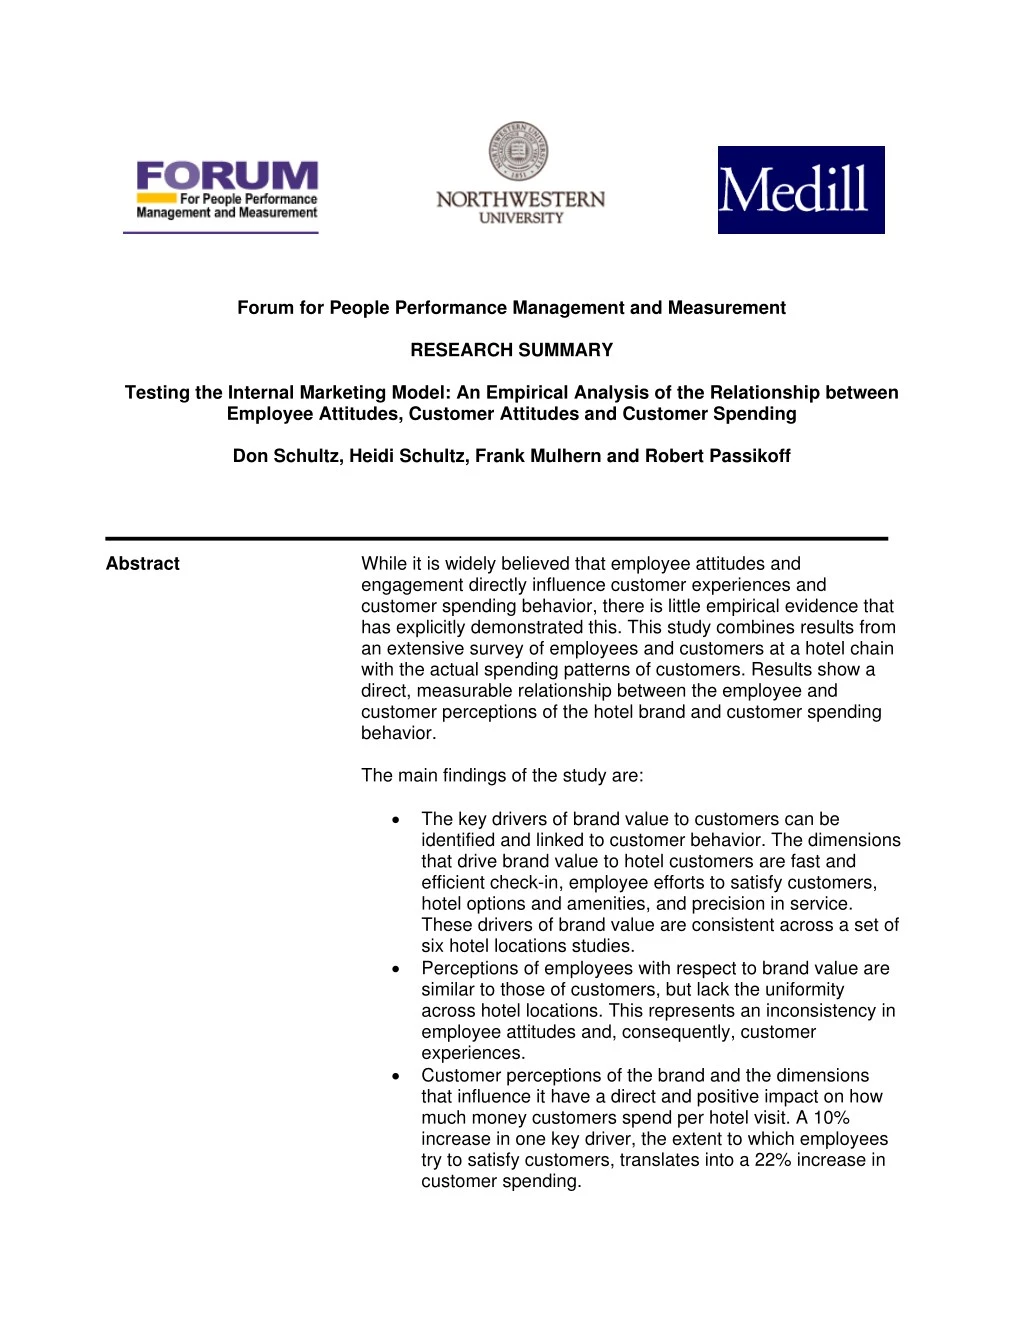
Forum for People Performance Management and Measurement RESEARCH SUMMARY Testing the Internal Marketing Model:An Empirical Analysis of the Relationship between Employee Attitudes, Customer Attitudes and Customer Spending Don Schultz, Heidi Schultz, Frank Mulhern and Robert Passikoff While it is widely believed that employee attitudes and engagement directly influence customer experiences and customer spending behavior, there is little empirical evidence that has explicitly demonstrated this. This study combines results from an extensive survey of employees and customers at a hotel chain with the actual spending patterns of customers. Results show a direct, measurable relationship between the employee and customer perceptions of the hotel brand and customer spending behavior. Abstract The main findings of the study are: • The key drivers of brand value to customers can be identified and linked to customer behavior. The dimensions that drive brand value to hotel customers are fast and efficient check-in, employee efforts to satisfy customers, hotel options and amenities, and precision in service. These drivers of brand value are consistent across a set of six hotel locations studies. Perceptions of employees with respect to brand value are similar to those of customers, but lack the uniformity across hotel locations. This represents an inconsistency in employee attitudes and, consequently, customer experiences. Customer perceptions of the brand and the dimensions that influence it have a direct and positive impact on how much money customers spend per hotel visit. A 10% increase in one key driver, the extent to which employees try to satisfy customers, translates into a 22% increase in customer spending. • •
The findings of the study represent a formal test of an internal marketing model whereby management actions to influence employee attitudes and behaviors can translate into customer behavior and organizational performance. This study is conducted under the auspices of the Forum for People Performance Management and Measurement, an organization that provides funding for research in understanding motivation, employee engagement, and internal/external alignment. Research Purpose This study presents the results of an Integrated Internal Marketing (IIM) Model testing at a major hotel chain. The IIM Model is designed to link employee and customer behaviors to financial outcomes as shown below. The expectation of the IIM Model are: 1) There is a direct connection between employee and customer behaviors that can be measured, monitored and managed; 2) A key measure of employees’ value is their impact on the income flows from customers; and 3) Employee and customer behaviors can be linked and the financial value of change can be determined. The essence of the IMM framework is: • Identify a set of relevant customers – determine current and potential future financial value • Survey identified customers to determine internal marketing issues and opportunities • Relate and connect relevant employees to identified customers and current behaviors • Identify potential value of changing employee behaviors which might impact customer behaviors
Research Methodology To investigate the linkages between employee perceptions, customer perceptions and customer behavior, the study combined information from employee and customer surveys with customer spending behavior drawn from a loyalty program database. The objective of the employee and customer surveys was to calibrate the strength and meaning of the hotel brand and its services. The research was conducted at six locations of a major hotel chain. The locations were selected to represent both business and leisure properties in three different cities. Surveys were administered in person by a research associate who visited each hotel and asked employees to complete a paper survey form. The customers included in the study were randomly selected from the hotel’s loyalty club database. Selected customers were interviewed by telephone. The employees and the customers were asked the same set of questions about the hotel brand as well as about a theoretical ideal hotel and a major competing hotel. Collecting information about perceptions of an ideal and competing hotel allows for comparison of brand perceptions on key dimensions. Information from the customer surveys was paired with data on customer visitation and spending behavior from the loyalty program database for the exact same customers. Matching customer survey responses to actual spending behavior allows for strong inferences about the relationships between perceptions and behavior. Value Drivers in Hotel Category The study utilizes an assessment of the drivers of brand value developed by Brand Keys, Inc. That framework establishes and measures both emotional and rational psychological dimensions and shows how they determine brand equity. In this study, the Brand Keys model produced four results in four value drivers, which were named for their attribute, benefit and value components, shown as follows:
The details of each of the value drivers are: Driver #1: Fast & Efficient Check-In This Driver represents the impact of the first impression the customer has about the service and value the hotel provides. The check-in experience puts a mark on the customer’s overall perception of the brand and service. Driver #2: Tries to Satisfy Customers The main purpose of Driver #2 is to transform Customer Satisfaction into Customer Loyalty. This represents an extremely welcoming and helpful staff that provides constant attention and is always available to assist the customers. The ambiance is also critical to create a welcoming feeling, which a customer always remembers and associates with a certain brand. Driver #3: Options & Amenities Driver # 3 concentrates on constantly providing customers with information on hotel incentives, like special offers or amenities. For a best result, the staff has to be extremely well informed and always confirming that the customers are aware of what the hotel offers. Driver #4: Strives for Precision When it comes to precision, a hotel aims to impress the customers by not allowing any little flaws. Giving the customer the expected service, assistance or information produces a sense of reliability and responsibility and affects the customer’s overall perception of the hotel.
Drivers of Brand Value for Customers For all six hotel locations, spanning both business and leisure locations and union or nonunion employees, the customer value drivers were the same, and ranked in the same order of importance. The drivers are identified and described below. They were named based on their attribute, benefit and value components. Driver #1: Fast & Efficient Check-In This driver represents customer perception of the check-in experience and explains 35% of the variability in overall brand perceptions. Fast and efficient check-in has three main elements: 1. The hotel has an adequate number of front-desk staff for checking in guests. This attribute contributed to 22% of the value driver. 2. Has an efficient check-in process. This attribute contributed to 21% of the driver. 3. Has no long line to check in, which contributed to 19% of this value driver. Driver #2: Tries to Satisfy Customers This driver represents perceptions about how committed employees are to customer needs. It explains 28% of the variability in overall brand perceptions. The three main elements of this driver are: 1. Has front-desk staff that makes you feel welcome. This attribute contributed to 23% of the value driver. 2. Has front-desk staff that proactively works to ensure your satisfaction. This attribute contributed to 23% of the value driver. 3. Has a pleasant décor, which contributed to 17% of the driver. Driver #3: Options & Amenities This driver represents perceptions about the interpersonal service provided by the hotel as well as the pricing and amenities offered. It explains 20% of the variability in overall brand perceptions. There are three attributes in the Options & Amenities factor: 1. Employees have a pleasant phone manner. This attribute alone contributed to 18% of this value driver. 2. Front-desk staff is knowledgeable about area restaurants and sites, which contributed to 18% of the value driver. 3. Offers you upgrades for free or at attractive rates. This attribute contributed to 15% of the value driver.
Driver #4: Strives for Precision This driver represents customer perceptions about the extent to which the hotel and its employees fulfill commitments with respect to basic services. It explains 17% of the variability in overall brand perceptions. There are three attributes in the Strives for Precision factor: 1. Have accurate details of your reservations at check-in, which contributed to 20% of this value driver. 2. Is able to make changes to your guest information efficiently, which alone contributed to 18% of this value driver. 3. Has front-desk staff that cares about you, the individual traveler. This attribute contributed to 17% of this value driver. 4. Confirms your reservation details with you when you get in, which contributed to 16% of this value driver. Analysis of Customer Value Drivers Customer perceptions of the hotel on each of the four drivers were compared to perceptions of a theoretical ideal hotel as well as a single major competitor. Customers perceive that the biggest gap between this hotel and its major competitor is Value Driver #2: Tries to Satisfy. As shown in the figure below, customers indexed Tries to Satisfy at 116 for the ideal hotel, compared to 106 for the studied hotel and 95 for the competing hotel. The numbers represent an index that scales the respondent’s evaluation relative to other hotels. In addition, because Value Driver #2 is the second most important loyalty driver in the hotel category and it has the greatest potential for the major hotel to achieve the ideal hotel index, the major hotel should put more effort toward the Tries to Satisfy area. Customer Assessment 140 116 120 111 108 106 105 105 103 103 98 98 95 93 100 80 60 40 20 0 Fast & Efficient Check-In = 35% Tries To Satisty Customers = 28% Options & Amenities = 20% Strives For Precision = 17% Ideal Hotel Studied Hotel Competing Hotel
Drivers of Brand Value for Employees A comparable analysis was done of the four value drivers with the results of the employee survey. Across the six locations of the hotel, there are substantial differences in the order of value driver importance. For example, some business hotels consider Fast & Efficient Check-In the number one value driver while some leisure hotels think that Tries to Satisfy is the most important value driver. While results were somewhat similar between the response of the employees and the customers, the fact that employee perceptions varied so much across hotel locations demonstrated an inconsistency in attitudes and commitment to service customers on the part of employees. In other words, employees at different locations place different importance on the elements that make up the customer experience. This is a problem because it means that customers will have inconsistent experiences across hotel locations and the level of employee commitment differs across locations. This is at the heart of the internal marketing model and demonstrates the need for strong internal communications and employee engagement, particularly given that customers were so consistent about what they value in the hotel brand. Comparison to Competing Hotel From the customer assessment perspective, the hotel we studied is doing a better job in all four value drivers. As shown in the chart below, the largest gaps between the major hotel and the major competitor customer assessments are on Value Driver #1: Fast & Efficient Check-In, which has the index difference of 12, and Value Driver #2: Tries to Satisfy, with an index difference of 11. This indicates that these two areas are the competitive advantages for the major hotel.
Customer Assessment 140 116 120 111 108 106 105 105 103 103 98 98 95 93 100 80 60 40 20 0 Fast & Efficient Check-In = 35% Tries To Satisty Customers = 28% Options & Amenities = 20% Strives For Precision = 17% Ideal Hotel Studied Hotel Competing Hotel Value Driver #2: Tries to Satisfy is the most important for developing the relationship between the hotel brand and its customers. Based on these results, we would expect that perceptions represented by Tries to Satisfy are the strongest predictors of customer spending behavior. (A later section will explore this.) However, from the employee perspective, there is little difference between the major hotel and its competitor on Value Driver # 2: Tries to Satisfy and Value Driver # 4: Strives for Precision as shown below: Employee Assessment 110 105 105 100 100 100 100 100 100 95 95 90 90 85 80 Fast & Efficient Check-In = 36% Tries To Satisty Customers = 31% Options & Amenities = 26% Strives For Precision = 7% Employee of Studied Hotel Employee of Competing Hotel The biggest index differences between the two hotels from the employee perspective are on Value Driver #1: Fast & Efficient Check-In and Value Driver #3: Options and Amenities, both with an index difference of 10. The fact that employees see their hotel, relative to the major competing hotel, differently than customers is
somewhat troublesome. It shows a disconnect between how employees view the hotel brands and customer perceptions and experiences. This outcome clearly calls for a more coherent and focused internal marketing practice. Linking Customer Drivers toCustomer Behavioral Spending A major aspect of the internal marketing model is connecting customer drivers of the brand to actual hotel visitation and spending patterns. The study analyzed four metrics of customer behavior over the previous three years – total amount spent at the hotel chain, spending per visit to the hotel, the number of nights visited and the number of overall visits. Statistical models were used to link the drivers of brand value to these four behaviors. Guest behavior is measured through the major hotel’s loyalty program database information from 2003 to 2005. There were 300 customers studied who, on average, spent a total of $869, made 1.2 visits totaling 3.3 nights and spent $724 per visit. Results for the relationship between the four value drives and the four behaviors are shown below: • Total Spending: Of the four psychological drivers, only one, Tries to Satisfy, is a significant determinant of total spending dollars. A 10% increase in a customer’s score on Tries to Satisfy, yields a 22.7% higher level of customer spending over the three years. Spending per Visit: Of the four psychological drivers, only Tries to Satisfy is a significant determinant of dollars spent per visit. A 10% increase in Tries to Satisfy yields a 20.3% increase in the amount customers spend per visit. Number of Visits: Number of visits was not affected by any of the four drivers. Number of Nights: Number of nights was not affected by any of the four drivers. • • • Modeling Approach The model measures the link between the psychological drivers (predictive variables) and the four metrics of guest behavior (dependent variables).The model was designed to explain different levels of visitation and spending behavior as a function of the four Brand Keys psychological drivers: Strives for Precision, Fast and Efficient Check-in, Options and Amenities and Tries to Satisfy Customers.
Result 1: Total Spending Of the four psychological drivers, only one, Tries to Satisfy, is a significant determinant of total spending dollars. A statistical analysis of the relationship between Tries to Satisfy and total spending generated a response coefficient of 2.27, indicating a 10% increase in a customer’s score on Tries to Satisfy yields a 22.7% higher level of spending over the three years. The table below (Table 1) shows a comparison of the index scores on the four psychological dimensions for customers grouped according to spending level. Table 1 Mean Index Scores for Total Spending Categories 2003-2005 Spending Category Top 20% 105.0 113.5 Bottom 80% 103.7 107.8 Fast and Efficient Tries to Satisfy Options and Amenities Strives for Precision 104.8 103.2 98.7 101.2 Top 33% Middle 33% 104.7 Bottom 33% 102.9 104.3 104.3 103.6 102.6 99.2 102.0 100.8 111.8 107.7 107.8 Among the four value drivers, Tries to Satisfy is the only one to have a statistically significant difference in the index score between the top 20% and bottom 80% of customers, grouped by spending levels. This indicates that these top Total Spending customers generally think the major hotel is succeeding at trying to satisfy its customers. Result 2: Spending per Visit Of the four psychological drivers, only one, Tries to Satisfy, is a significant determinant of total spending per visit. A response coefficient of 2.03 reveals that a 10% increase in Tries to Satisfy yields a 20.3% increase in spending per visit. The table below (Table 2) shows a comparison of the index scores on the four psychological dimensions for customers grouped according to spending per visit: Table 2 Mean Index Scores for Spending per Visit Categories 2003-2005 Spending Category Top 20% 105.2 113.9 Fast and Efficient Tries to Satisfy Options and Amenities Strives for Precision 105.4 100.7 Bottom 80% 103.7 103.0 101.0 107.9 Top 33% 104.7 104.7 99.1 112.4 Middle 33% 104.8 Bottom 33% 102.8 102.9 103.0 101.8 100.7 108.2 107.3
Among the four value drivers, Tries to Satisfy is the only one with a significantly different mean index among the top 20% versus the bottom 80% of customers in spending per visit. Result 3: Number of Visits and Number of Nights Number of visits and number of nights were not affected by any of the four drivers. Conclusion The key take-away for the major hotel is that Tries to Satisfy is a key driver of the total amount of money customers spend over time and the amount of money guests spend per visit. Enhancements in this psychological dimension translate directly into increased spending and hotel performance. This conclusion shows that employee behaviors, viewed from the customer perspective, have a direct and positive impact on how much money customers spend. Enhancements in Tries to Satisfy (primarily making customers feel welcome and satisfying their needs) translate directly into increased spending by customers. For more information contact: Doug Press President, The Incentive Group dougp@incentivegroup.com