Download
1 / 22
220 likes | 376 Views
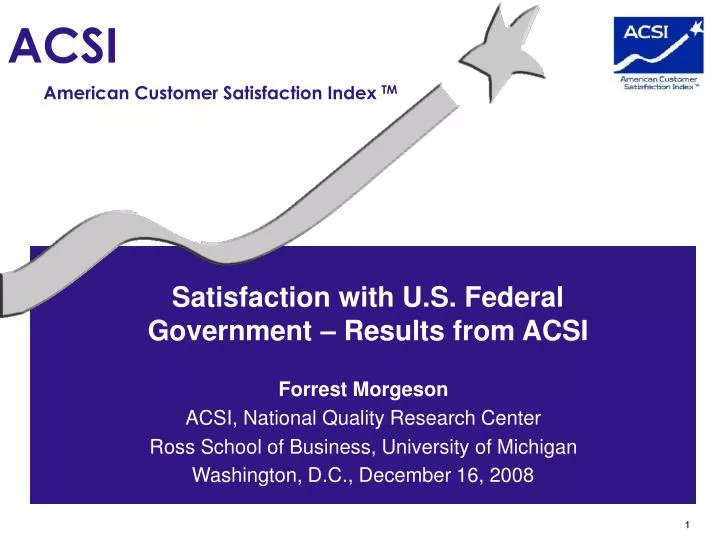
Satisfaction with U.S. Federal Government – Results from ACSI. Forrest Morgeson ACSI, National Quality Research Center Ross School of Business, University of Michigan. Washington, D.C., December 16, 2008. Snapshot of ACSI.

E N D
Satisfaction with U.S. Federal Government – Results from ACSI Forrest Morgeson ACSI, National Quality Research Center Ross School of Business, University of Michigan Washington, D.C., December 16, 2008
Snapshot of ACSI • Established in 1994, ACSI is the only standardized measure of customer satisfaction in the U.S. economy, covering approximately 200 companies in 45 industries and 10 sectors; companies measured account for roughly one-third of the U.S. GDP • A quarterly measure of the national economy’s health; complementary to measures such as inflation and unemployment • 50+ departments and agencies of the U.S. Federal Government measured on an annual basis • Results from all surveys are published quarterly in various media and on the ACSI website, www.theacsi.org
ACSI and Government Satisfaction • ACSI measured portions of Federal Government as early as 1994 • Internal Revenue Service measured as part of the ACSI private sector study back to 1994 • In 1999, ACSI chosen as the “gold standard” measure of customer satisfaction by the Federal government • Funded by the Federal government, ACSI measured 30 “high impact” government agencies, reflecting the vast majority of citizen interactions with government, in 1999 and 2000 • Although now relying on optional agency buy-in, participation in the ACSI study has grown significantly
Why Measure Satisfaction with Government? Raise trust in agencies and the government overall Enable Senior Executives to meet performance criteria Identify areas for improving quality of service provided to customers Provide critical information for annual performance plans to Congress (as required under GPRA) Link customer satisfaction with expectations and desired outcomes ACSI Set “baseline” for customer satisfaction and measure progress Benchmark against “best” in business and government
ACSI Methodology • Customer satisfaction (ACSI) is embedded in a system of cause and effect relationships • Measures are general enough to be comparable across agencies, and private sector companies • ACSI is measured using multiple indicators • Objective: Explain desired outcomes
ACSI Methodology ● A component score is a weighted average of the set of attributes, or survey questions, comprising a component or activity. Responses to survey questions are given on a 1-10 scale, which is converted to a 0-100 scale for score reporting. ● An impact, on the other hand, predicts the increase in satisfaction that would result from a 5-point increase in a component or input score. ● Areas for improvement are those components or activities with a relatively low score and a relatively high impact on satisfaction. EXAMPLE Activity 1 76 In the simplified example shown here, Activity 2 would be a key action area due to its relatively low score and high impact. .8 ACSI 65 1.5 Activity 2 65 Impact Score
2008 ACSI RESULTS FOR THE U.S. FEDERAL GOVERNMENT
Aggregate Customer Satisfaction with Federal Government, 1999-2008* *A methodology change in 2007 limits comparability to prior years. Year-to-year trending is recommended.
2008 Federal Government ACSI Model 73 Process 73 • Ease • Timeliness 74 1.8 75 Information 74 0.6 • Clarity • Accessibility 9% 76 75 Perceived Quality Customer Complaints 1.6 80 4.0 Customer Service 79 • Courtesy • Professional 69 -1.9 Customer Satisfaction (ACSI) 80 2.3 0.0 1.1 74 • Ease • Usefulness Website 70 4.5 69 70 79 0.2 Customer Expectations Agency Trust 69 • Confidence • Recommend 72 N = 1401; 90% Confidence Interval = 1.1
Complaints are Handled Poorly, and… Complaint Handling Score (0-100)
Agency and Diffuse Trust ● For 2008, ACSI measured both agency trust (trust with the agency experienced), and a new variable diffuse trust (trust in the Federal government as a whole). This new variable asked the following question: -”Generally speaking, how much of the time do you think you can trust the government in Washington?” ● Perhaps not surprisingly, and similar to the results found in other studies asking this question, this new variable scored considerably lower…
Agency and Diffuse Trust 70 Agency Trust 1.7 37 Overall Trust in Federal Government 4.5 69 Customer Satisfaction (ACSI) 0.0 ● These results show that while satisfaction with an agency experience does not drive diffuse trust in the government, it has a strong effect through agency trust -In other words, agencies that offer a more satisfying experience will both build trust in their agency, but also help build (or rebuild) general trust in the entire Federal government among American citizens.
ACSI • For more information, visit the ACSI website at: www.theacsi.org