Download
1 / 40
400 likes | 532 Views
22th North America-Europe Data Exchange Meeting Reading, UK, Dec. 09-11, 2009. Deutscher Wetterdienst (DWD) status report Alexander Cress With contributions from Rheinhold Hess, Andreas Rhodin, Marco Schwaerz, Klaus Stephan. DWD’s new building 2008. New central computer facilities:

E N D
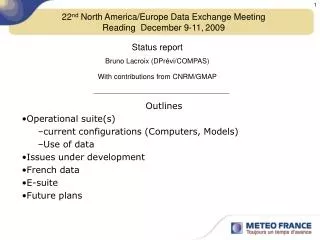
22th North America-Europe Data Exchange Meeting Reading, UK, Dec. 09-11, 2009 Deutscher Wetterdienst (DWD) status report Alexander Cress With contributions from Rheinhold Hess, Andreas Rhodin, Marco Schwaerz, Klaus Stephan
DWD’s new building 2008 New central computer facilities: • Computer area 1100 m2 • Uninterruptible power supply up to 3000 kW
New computer system at DWD Vector Computer NEC SX-9 System specification • 102.4 GFlops / CPU • 1.6 TFlops / Node • 512 GB Main Memory per node • 16 CPUs per node • Frequenzy 3.2 GHz • Ultra-High bandwidth shared memory • subsystem (256 GB/s per CPU) • Internode crossbar switch (IXS), • 128 GB/s bidirectional per node • DWD 14 nodes per cluster, 2 clusters, 1 test node
Global Model GME • Operational NWP Model of DWD • gridpoint model, hexagonal triangular grid • 40 km mesh size, 36870 grid points/layer • 40 layers (hyprid, sigma/pressure) • prognostic variables: ps, u, v, T, qv, qc, qi, o3 • 3DVAR (PSAS) system • incremental digital filter initialization (P.Lynch) • At 00 UTC and 12 UTC: forecasts for 174 hours • At 18 UTC: forecasts for 48 hours
3-D Variational Data assimilation (PSAS) • Replacement of the Optimum Interpolation (OI) scheme • Operational since Sep. 2008 and operational on NEC SX9 since Sep. 2009 • Minimization in observation space • Allows assimilation of observations with highly nonlinear dependence on the background variables (e.g. remote sensing) • Wavelet representation of the B-Matrix • Separable 1D+2D approach • vertical: NMC derived covariances (64 levels) • horizontal: Wavelet representation (512x256 Gaussian grid) • Goals: • Flexible representation of B-Matrix • 3D non-separable representation • NMC or ensemble derived covariances
Observational Use in 3DVAR Synop Aircraft Buoy Radiosonde Pilot AMSU A AMV Scatterometer
Alexander Cress Anomaly correlation coefficient of geopotential height in 500 hPa 2007051400 – 2007053100 (18 forecasts)
Use of AMSU-A auf NOAA-15, 16, 18, AQUA und METOP-A (seit 21.11.07) Alexander Cress
Using Metop ATOVS radiances: Clear positive impact for all areas (00 UTC)
Use of radio occulation measurements A electromagnetic signal, transmitted by a GPS satellite, is delayed due to the presence of free electrons in the ionosphere an the refractivity of the atmosphere The refractivity is directly linked to horizontal and vertical variation of temperature, pressure and water vapour The refraction of the GPS signal corresponds to a shift in its phase, recorded at the receiving LEO satellite. Additionally, the signal path undergoes a bending in the atmosphere, resulting in a bending angle Relative geometry of the GPS and LEO and the Earth changes during the occultation event, the signal path intersects the atmosphere vertically, thus providing a vertical profile of bending angle. Observation error can be derived from the signal-noise-ratio of the amplitude of the signal Observed quantity to be assimilated can be bending angle (DWD) or refractivity (Met Office) profiles Benefits: High vertical resolution, independence of cloud conditions, lack of fundamental biases, uniform global coverage Observation coverage
Use of scatterometer data at DWD Read SCATT (25 km BUFR data) Data from data base or file or ECMWF MARS System • 10 m wind vectors (most likely wind) • QuikScat and ASCAT • Global and regional • Use of multiple wind solutions (planned) • Experiments with OI and 3DVAR Pre SCATT - read in original Bufr - data selection within analyses time window - eliminates overlapping orbits - computes KNMI rain flag; data flaging - computes direction check; data flagging - computes bias correction - data selection based on quality control - thinning - output options: Bufr; netCDF, ascii OI - Analyses - (u/v) most likely wind - coded as Pseudo-Buoy (Bufr) 3DVAR - Analyses - (u/v) more than one wind - coded as Bufr/netCDF Offline Monitoring - colloc. with GME -FG/Ana - analyses of data quality
Scatterometer Data Coverage 2008022500 +/- 1.5 H ASCAT (red) QuikScat (blue)
Scatterometer data in the Parallelroutine Tropical Storm 02B 2009052412 sea level pressure [hPa] Parallelroutine Routine Roup - Rou ECMWF
Scatterometer data in the Parallelroutine Tropical Storm 02B 2009052412 vv=12h sea level pressure [hPa] / max windspeed [m/s] Routine Parallelroutine
Anomaly correlation coefficient for sea level pressure Northern Hemisphere Southern Hemisphere Crtl Crtl plus SCAT Crtl Crtl plus SCAT Crtl Crtl plus SCAT Europe VV=72h
Use of the polar AVHRR wind vectors in the global analyses system of DWD • Polar regions with small observation density • Polar regions show still large observation errors • Polar lows have influence on weather regimes • in Europe and North America • Polar AMV winds from Terra and Aqua only • Experimental • No operational satellite programm planned for • Derivation of AMV wind vectors in polar regions • Deriation of wind vectors from polar orbiting • NOAA satellites (15/16/17/18) and Metop • Only infrared winds • Height assigment more problematic than for Modis winds
AVHRR OBS – FG Statistik 2008081400 – 2008083121 All Data mit QI > 65 700 hPa – 400 hPa Metop NOAA 17 NOAA 18 Modis/Terra
Anomaly correlation coefficient of the 500 hPa geopotential height 2008100200 – 2008102300 00 UTC 22 cases Control (red) Exp. with AVHRR Winden (blau)
Time series of anomaly correlation coefficients 96-h forecast of the 500 hPa geopotential height field 2008100200 – 2008102300 00 UTC NH TR Routine Exp. Mit AVHRR SH EU
Direct Broadcast MODIS Winds Motivation • MODIS polar winds are not available in time to be used in assimilation of main run. • Only available in assimilation run • Direct broadcasting winds can be received much earlier ~ 100 minutes or more • Winds from a variety of stations • Tromso - Terra Modis • Sodankyla - Terra Modis • Fairbanks - Terra Modis • McMurdo, Antartica - Terra/Aqua Modis • Provide only partial coverage and only Terra can be received in the NH • At DWD, no MODIS winds could be used in the main runs. Using DB winds, some polar winds • can be used also in the main run. Additionally, more polar winds can be used in the assimilation
Data coverage 00 UTC 12 UTC Alexander Cress
Number of Observations StoreTime
OBS –FG Statistics Terra QI > 65 20090111 - 20090119 IR 400 – 0 hPa IR 700 – 400 hPa Mean: -0.05 Mean: -0.13 WV 400 – 0 hPa WV 700 – 400 hPa Mean: -0.26 Mean: 0.38
Lokal-Model COSMO-EU (LME) und COSMO-DE (LMK) COSMO-EU (regional model): non-hydrostatic, rotated lat-lon grid, mesh-size: 7km terrain-following hyprid coordinate with 40 layers up to 20 hPa forecast range: 78 h every 6 hours prognostic cloud ice, prognostic rain schemes boundary values from GME Analysis: continuous nudging scheme observations: radiosonde, pilots, wind profiler, aircraft, synops, buoys, ships cut-off: 2h30min variational soil moisture analysis COSMO-DE (lokal model): similar to COSMO-EU forecast range 18 h every 3 h mesh-size: 2.8 km, explicit convection latent heat nudging of radar reflectivities boundary values of COSMO-EU ww COSMO-DE COSMO-EU GME
Opr (no QSCAT) – Exp (QSCAT) PMSL 19 June 2007, 9 UTC hPa QSCAT 19 June 2007, 6 – 9 UTC 15 W 50N 48N Assimilation of Scatterometer Wind in COSMO-EUHeinz-Werner Bitzer (MetBw), Alexander Cress, Christoph Schraff (DWD) • nudging of scatterometer wind data technically implemented, taking into account all quality control / bias correction steps developed for use in GME • idealised case studies: model rejects largest part of 10-m wind info unless mass field is explicitly balanced derive surface pressure analysis correction in geostrophic balance with 10-m wind analysis increments (implies need to solve Poisson equation): implemented, model now accepts data • first real case study computed
too strong gradient too low No scatt with ASCAT / QuickScat COSMO-EU 9-h forecasts, valid for 6 March 2008, 9 UTC pmsl (model – obs)
COSMO-EU ana , no scatt COSMO-EU ana with ASCAT/QuickScat 975 hPa 10-m wind [m/s] ASCAT 28 Feb 08, 21 UTC ± 1.5h ECMWF analysis 29 Feb 08 max. 30 kn ~15 m/s 984 hPa
Compariosn of surface weather elements between COSMO-EU Routine and COSMO-EU experiment including Scatterometer data 27/02/2008 – 09/03/2008 00 UTC Routine Exp. with Scatt
Assimilation of IASI Measurements into the COSMO-EU Michael Schwärz EUMETSAT Fellow • Infrared atmospheric sounding interferometer onboard Metop • IFOV: 3.33o (48 km nadir) • Swath: +/- 1026 km • 8461 channels ⇨ 300 channels selected by IC • Use of RTTOV 9 within 1DVAR • Bias correction (Harris and Kelly 2001) • Cloud detection • IASI level 2 cloud flags • b) after McNelly and Watts (2003) • Use of temperature and humidity profiles in COSMO EU
Experiment design • 215 temperature channels from 15 µm band • 6.25 µm wv band • IASI level 2 flags for cloud detection • COSMO-EU + IASI 1DVAR profiles • Results • Data processing and nudging works • Positive results in upper air verification • Stronger for RMS than Bias • Heighest for geopotential height in the • upper troposphere and humidity in the • middle troposphere Outlook Better channel selection Thinning in COSMO – EU Use of cloud detection by McNelly and Watts
Domain of COSMO-DE and German Radar Network COSMO-DE • 2.8 km solution with 50 vertical layers • Runge Kutta time integration • Explicit deep convection/ param. shallow conv. • Rain, snow, graupel • Started every 3 hours (30 min cut off) • Forecast range 21 h • Nudging of conventional data • Latent Heat Nudging of radar derived rain rates (16 German stations, will be extended to about 30 stations, soon) To provide the nowcasters a appreciate guidance on severe weather events related to deep moist convection (super- and multi-cell thunderstorms) or to small scale orography COSMO-DE
Comparison of forecast starting with and without LHN Skill scores for a convective period (14 days) for 0.1 mm/h about noon (12 UTC) about midnight (00 UTC) LHN noLHN LHN noLHN ETS ETS LHN noLHN LHN noLHN FBI Events Forecast starting from LHN analysis are better LHN via noLHN
Room for improvement: data base • Up to now used withtin LHN: • All 16 German stations • Shortly to be extended with • 3 Dutch stations • 2 Belgian stations • 10 France stations • 3 Swiss stations • Quality Control • Clutter filter • Cross error detection • Bright band correctio • blacklisting (comparison to satellite picture)
Forecast with orig. data New Radar Composite Forecast with new data Impact of extended data: Hourly Precipitation on 25.05.2009 12 UTC +5h Forecast is improved by extended data base Extended Data Base
Summary • 3DVAR outperforms OI and is operational since mid Sep. 2008 • Positive impact of ATOVS radiances from Metop and NOAA 19 • Use of radio occulation in 3DVAR showed some promising results • Positive impact of scatterometer data in global and regional • forecasts • Substantial benefit of AVHRR and DB MODIS polar winds • First results of using IASI data in COSMO-EU promising • LHN ofradar derived rain rates is beneficial for the forecast, • esp.for nowcasting purposes
Plans for the next years • Continuation of experiments using Radio Occultation data • including Metop • Use of AMSU B & MHS data (first experiments running) • Use of AIRS & IASI data in GME (already started) • Prepare for ADM mission • Use of VAD and radar radial winds in COSMO Models • Use of GPS humidity data (COPS reanalysis) • Development of a new non-hydrostatic Global Model with • local zooming (ICON) • Development of an Ensemble Kalman Filter (LETKF) for the new model ststem
Thank you for your attention