Download
1 / 35
350 likes | 486 Views
Accounting for Social Outputs. OISE Certificate Course B.J. Richmond Faculty of Education, York University Bjrichmond@edu.yorku.ca February 23, 2004. Agenda: February 23, 2004. PRESENTATION. Presentation: Outline. Accounting For the Value of Social Outputs Use, levels Data Required

E N D
Accounting for Social Outputs OISE Certificate Course B.J. Richmond Faculty of Education, York University Bjrichmond@edu.yorku.ca February 23, 2004
Presentation: Outline Accounting For the Value of Social Outputs • Use, levels • Data Required • Framework: CSROI model • Steps • Tips
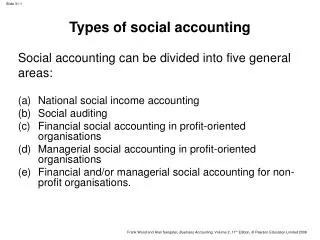
Use • To provide a more complete picture of the organization’s impact on the community • Prepare a social report (full or partial) • Present along with the financial report • For stakeholders • Display in Annual Report
Levels of Reporting • Based on resources available • Full social report • Partial social report • Key outputs • One program • Volunteers only • One or two key indicators
Data Required, Sources • Financial information • Mission, niche: Strategic Plan • Outputs • Primary: deliverables from contracts, mission, funding agreements • Secondary: deliverables, survey, focus group • Tertiary: Comparative market value • Staff, Board, volunteer information
Inputs Revenues Volunteer Contributions Outputs Expenditures Volunteer Contributions Program Outputs Primary Secondary Tertiary Model: Community Social Return on Investment
Outputs • Primary • Direct effects on clients, recipients of service, audience • Secondary • Indirect effects on clients, recipients of service, audience • Tertiary • Effects on those other than clients
Inputs Revenues $837,614 Value of Vol 65,853 Total $903,467 Outputs Expenses $842,051 Value of Vol 65,853 Program Outputs: Primary-employmt 599,320 training 113,988 Secondary * ------- Tertiary- income svgs 13,524 serv. svg 2,300 Total $1,637,036 Ratio: 1:1.81 CSROI Case: Computer Training Centre 1994 - 1995
Social Outputs: Primary • Employment • Valued as amount in wages earned by those employed (6 mo.) • Verified • By checking previous, post year grad earnings as reported by agency to funder; interviewing grads from case study year, post case study year.
Outputs: Secondary • Training • Valued at the market cost of the training for those not employed (6 mo) • Impacts on clients • Could not be quantified but reported qualitatively • Examples: improved health, well-being • Reported numbers, statements
Outputs: Tertiary • Costs saved from income assistance • Data from client records, interviews • Included costs saved for medical, dental, clothing allowance • Benefits to community, suppliers, employers • Reported qualitatively
Steps: Assess primary, secondary, tertiary outputs • Examine Records • Logic model if available • Funding agreements, contracts, mission • Brainstorm with staff about secondary and tertiary outputs • Determine ways of counting, capturing • Develop a data collection plan
Steps: Collect, analyze data • Develop and administer • Survey • Focus groups • Interview questions • Data analysis • Quantitative • Qualitative
Steps: Assign Comparative Market Value • Find the closest comparison value for the item – look first to the private sector market, then to public or nonprofit comparisons • Use the value for the closest approximation – choose cautiously
Steps: Find social indicator studies • In your field, through an apex organization such as the National office • Through a social research body such as Canadian Council on Social Development, Social Planning Councils, Canadian Policy Research Networks, etc.
Steps: Verify, attribute • Use survey, focus groups to verify information • Attribution analysis (John Mayne, Auditor General’s office) • Don’t overstate • Provide clear rationale • Trust your instincts
Steps: Report • Include context: internal and external • Mission, niche of the organization • Role of volunteers • Report outputs: quantitative, qualitative • Describe methods • Discuss attribution, limitations (not all outputs can be counted, etc.)
Recap: Steps • Assess primary, secondary, tertiary outputs • Collect, analyze data • Assign comparative market value • Find social indicator studies • Verify, attribute • Report
Discussion Questions 1. Any questions about the presentations? 2. Discussion Questions: • What are the uses of a full social report? Partial social report? • What are the benefits of attempting it? • What are the challenges? • How might stakeholders react to it?
Group Exercise: 3 Steps – General Instructions • Your group has 45 minutes to do the exercise, so time is tight • You will need some paper, a pen, and one calculator to do this exercise • You will need to prepare a short (5 minute maximum) report back to the class – so allot time accordingly
Group Exercise: To note • You may not be able to get everything done, but get as far as you can • Try to get to the discussion of assigning a comparative market value to one or two outputs. • Report back on whatever you were able to do in the time allotted.
Step 1: Identifying outputs • Briefly share information on primary, secondary, and tertiary outputs for your organization that you brought today • Use this information if it is viable to select one of each type of output (p,s,t) • Note: if this is not viable use a hypothetical case (see slides 30,31)
Step 2: Valuing outputs • Discuss how to account for each output (primary, secondary, tertiary) you selected – what to count, describe • How would the organization collect data on them; attribute results to the organization? • Attribute a comparative market value to outputs (or describe how to do it)
[Crescent Community Centre: Hypothetical Case] • CCC has been operating for 25 years in an impoverished community; wants to develop a social report to focus on its flagship program: the after school mentoring program that provides 800 kids with mentoring and has resulted in 100 youth going on to university that might not have done so otherwise.
[CCC: Case Study cont’d …] • Decide what one each of this program’s primary, secondary, and tertiary outputs might be • Decide how to: • Collect data on them, verify it, attribute the outputs to the organization, report it • Decide on a comparative market value for the outputs (or how you would do it)
Step 3: Reporting • Prepare a brief (5 minutes or less) report back to the class as a whole • Include information on organization’s: • Outputs • Value of outputs (include a brief section on attribution) • Just get as far as you can!
Step 3: Reporting, part 2 • If you have any time left, discuss how the organization might make the most effective use of this social report • When, which audiences, what format, • What are the potential benefits and challenges of this type of reporting
Things to think about • How can this type of information be used? • What are the benefits and challenges to using it? • What types of resources would be needed to produce it? • How can we report “intrinsic value”?