Download
1 / 25
260 likes | 360 Views
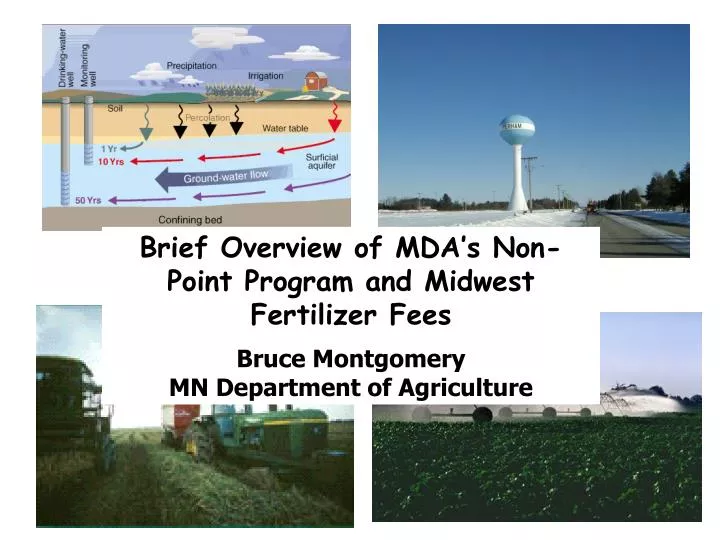
Brief Overview of MDA’s Non-Point Program and Midwest Fertilizer Fees Bruce Montgomery MN Department of Agriculture. MDA’s Non-Point Groundwater Program

E N D
Brief Overview of MDA’s Non-Point Program and Midwest Fertilizer Fees Bruce Montgomery MN Department of Agriculture
MDA’s Non-Point Groundwater Program Who are we? We are a small team of Agronomists/Soil Scientists responsible for responding in areas of the state where groundwater resources have been impacted by ag-chemical inputs (primarily nutrients) from non-point activities. Mission: Assist agricultural communities in achieving their water quality goals by providing cost effective response strategies; serve as liaison to the impacted producers by providing educational outreach, technical assistance, cost sharing opportunities, assessment of BMP effectiveness & adoption rates, and developing innovative partnerships
Legislative Foundation • Chap. 326, Art. 6, Sec. 33, Sub. 2b (Session Law) • Nitrogen Fertilizer Task Force • NFMP – prevention, evaluation & mitigation of nonpoint source nitrogen fertilizer • Finalized August 1990 • Minn. Stat. § 103H • Establish Agricultural Best Management Practices (to include demonstrations)
Effectiveness GOOD Effectiveness GOOD Effectiveness POOR Effectiveness POOR Adoption GOOD Adoption POOR Adoption GOOD Adoption POOR Continue BMP Promotion Modify BMP Promotion Re-evaluate Appropriateness of BMPs Rule Writing: Water Resource Protection Requirements Summary of Nitrogen Fertilizer Management Plan Process 3 Phases: BMP Promotion, Evaluation, Response
Regions of Minnesota Where Nitrates are Commonly Found in Groundwater Percentage of wells exceeding 3 mg/L. MDH County Well Index nitrate results summarized by agroecoregion. (Map courtesy of Dr. David Mulla, UM)
10 mg/L Health Standard St. Peter Source Water Protection Area
Community Water Suppliers Currently Responding to Nitrate Problems Park Rapids Cold Spring Perham St. Peter Lincoln Pipestone Rural Water System Hastings Edgerton, Luverne, Adrian, Fulda
Irrigators in the Perham’s Source Water Protection Area Responded to Water Quality Challenges!
Changes in MN Tonnage Fees Since 1989 (Not Including “Cleanup” Programs) Fee increase proposed by MDA approved 2004-05 Session Groundwater Protection Act was passed
MDA Staffing Projections-Responding to Nitrate Issues using Fertilizer Funds 2005-2007 Mississippi Corridor-Currently staffed part-time Central Sands-Currently staffed SW –One FTE needed for this region SE Karst-One FTE needed for this region.
Current Midwest Fertilizer Tonnage Fees Note that these figures includes the $0.15 increase to MDA starting 7/05
Current Midwest Tonnage & Research Fertilizer Fees Note that these figures includes the $0.15 increase to MDA starting 7/05
Helpful Conversion: Every 10 cent increase in Minnesota’s tonnage fees translates into $200,000 of revenue.
Current Fertilizer Tonnage Fees Including “Basic”, Research, and “Cleanup”
Cost per Acre of Cropland Including Basic Fees, Research and “Clean-Up” Type Programs
Grain Corn (Millions of Bushels) Nitrogen Use (Tons *1,000) Est. Nitrogen Sales Applied to Grain Corn 1988 Drought 1993 Floods Minnesota Corn Production and Nitrogen Fertilizer Use 1986-2004 Production
Minnesota’s Nitrogen BMP Design Statewide Special Situations Regional
Examples of States with Research and/or Educational Fertilizer Check-Off Programs • Wisconsin Established in 1978 • Iowa Established in 1987 • Illinois Established in 1990 • California Established in 1990 • Oklahoma Established in 1989 • Oregon • Missouri • Michigan
Midwest Research Fertilizer Funds (Total Revenue Generated) Fee on N Fertilizer provides $700,000 annually to Iowa’s Leopold Center WI Fertilizer Research(1/3), DNR (1/3), and Nutrient & Pest Management (Extension) (1/3) Currently MN does not have check off program Illinois Fertilizer and Education Council distributes over $450,000 annually
Wisconsin Fertilizer Fees fund a variety of programs
Considerations in Designing a Fertilizer Check-Off Program Will the program fund research, outreach or both? Who can compete for the funds? Land Grants? Agencies? Commodity Groups? The Research Review Process? Peer Review? The Board …Who and How? Governing Rules?
Possible Discussion Topics at Future Ag Nutrient Task Force Meetings • How are Fertilizer Check-Off Programs in other states structured? • Additional details and examples of how MDA responds to areas of Minnesota impacted by groundwater problems. • What other information does the Task Force need?