Download
1 / 9
90 likes | 144 Views
Warmup 1/17/13. Describe the walk shown in each graph. If you can, give the recursive routine. 3.3: Time-Distance Relationships. Pages 172 - 177. Learning Target. By the end of section 3.3, I will be able to tell what different time-distance graphs mean. Where is this stuff used?.

E N D
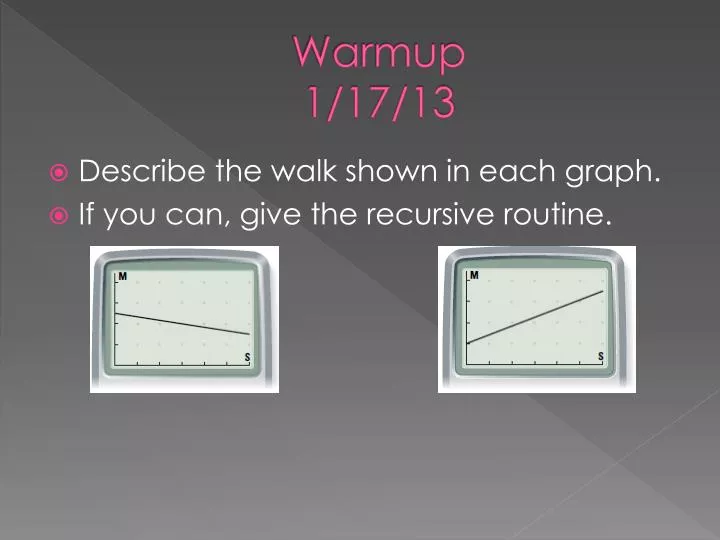
Warmup1/17/13 • Describe the walk shown in each graph. • If you can, give the recursive routine.
3.3: Time-Distance Relationships Pages 172 - 177
Learning Target • By the end of section 3.3, I will be able to tell what different time-distance graphs mean.
Where is this stuff used? • Time-Distance graphs are created by motion sensors. • Where are motion sensors used? • Police officers use them to stop speeders. • Security systems use them to stop bad guys. • What are some other examples?
What is Happening? • What are the following graphs describing if the motion sensor is at (0,0)?
Investigation 3.3: Walk the Line • In investigation 3.3, we are going to interpret some time-distance graphs and model some time-distance graphs with a motion detector. • First, interpret graphs in steps 1 3. • After you complete steps 1 3, bring it to Mr. Schaner to check and get a motion detector to do steps 4 and 5.
Investigation 3.3: Steps 4 5 • Your group will need: • Graphing calculator • Motion sensor • Directions: • Your group will try (it won’t be perfect) to create each graph a in step 1 with the motion sensor. (Use the Application “EasyData”) • Do it until you have a good match. • Rotate jobs and try to create graph b. • Rotate jobs and try to create graph c. • When you are finished with step 5, each person needs to create their own creative story of each graph (What could be happening?).
Did I Get That? – 3.3 • Write a set of walking instructions for the following graph (recursive routine). • Create a creative story to mimic the graph.