Download
1 / 10
100 likes | 203 Views
VERTIGO PHYTOPLANKTON PROCESSES Philip Boyd and Mark Gall Apologies for my absence. VERTIGO 1 – ALOHA – summary 2 PP profiles (ca. 180 and 220 mg C m -2 d -1 ) PP and stocks dominated by 0.2 – 2 micron fraction (66-90%) Few large cells (> 20 microns cells – 9% of PP)

E N D
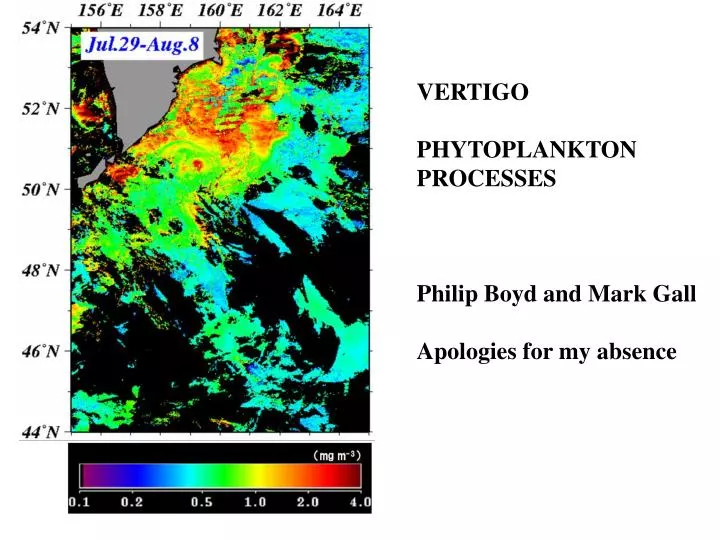
VERTIGO PHYTOPLANKTON PROCESSES Philip Boyd and Mark Gall Apologies for my absence
VERTIGO 1 – ALOHA – summary 2 PP profiles (ca. 180 and 220 mg C m-2 d-1) PP and stocks dominated by 0.2 – 2 micron fraction (66-90%) Few large cells (> 20 microns cells – 9% of PP) Fv/Fm – suboptimal – but higher at depth – N or P limited bugs Little change in [chl], PP etc during study
VERTIGO 2 – K2 – summary Distinct differences between 2 station occupations at K2 Deployment 1 –higher biomass and PP , (450 - 600 mg C m-2 d-1) PP and stocks dominated by >20 micron fraction (>40%) and < 2 microns (>40%) Fv/Fm – suboptimal – Fe limited as shown in perturbation expt Deployment 2 Deployment 1
VERTIGO 2 – K2 – summary Deployment 1 –higher biomass and PP , (300 - 450 mg C m-2 d-1) PP and stocks dominated by <2 micron fraction (>60%), > 20 microns = 20% Fv/Fm – suboptimal – Fe limited as shown in perturbation expt Fe stress increases diatom sinking rates (Waite and Nodder, 2000)
Honda et al. (2006) GRL During the VERTIGO Occupation of K2 Cells were Fe-limited in HNLC waters Changes in the Proportion of diatoms Probably driven by small Changes in Fe supply This has been observed in NE Pacific (Boyd & Harrison, 1999) V
LINKING THE SURFACE AND THE SUBSURFACE OCEAN Who is fixing the carbon? Who is producing ballasting Agents? Size-partitioning during K2 Chlorophyll Primary production BSi Floristics Pigments Use these to explore fate of Main primary producers PP Algal size structure Where is the water column “particle factory”? EP
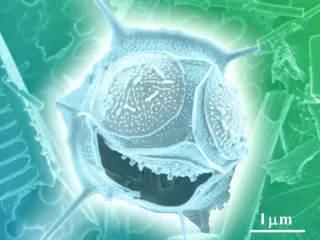
CTD 39 > 20 um diatoms Pseudo-nitzschia sp. Chaetoceros sp. Coretheron, few dino’s < 5 um Synechococcus, Some ANAN and Prochlorococcus CTD 66 > 20 um Chaetoceros spp. < 5 um cells – as before Size classes – who is there?
Occupation 2 > 20 micron cells comprise 80% of mixed layer BSi < 5% in < 2 micron fraction – diatom fragments? Similar trends to >150 m in BSi partitioning suggests strong surface supply Size classes – BSi
Modelling how different PP and size partitioning influence export flux Faecal-mediated flux H C Me Algal/faecal flux B P N M HOT EP ranges from 19 to 24 mg C m-2 d-1 (10-13% of PP) K2 Deployment 1 - EP ranges from 66 to 166 mg C m-2 d-1 (13-32% PP) Deployment 2 – EP ranges from 23 – 43 mg C m-2 d-1 (10-14% PP)
PHYTOPLANKTON PROCESSES i) Changes in both PP and community structure may result in a large shift in export production ii) Potential impact of episodic Fe supply on export – at K2 iii) HNLC vs. LNLC – little different in EP between HOT and K2 deployment 2 (10-14%) iv) Differences between K2 deployment 1 and 2 are a useful test of the relative role of the surface and subsurface ocean on export, sinking rates, b values etc.