Download
1 / 2
20 likes | 122 Views
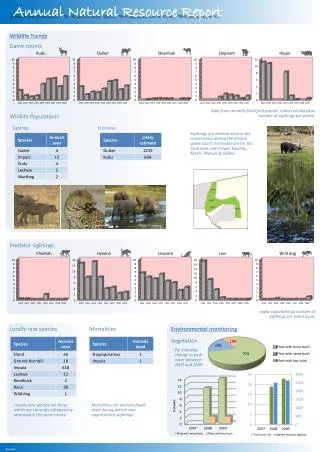
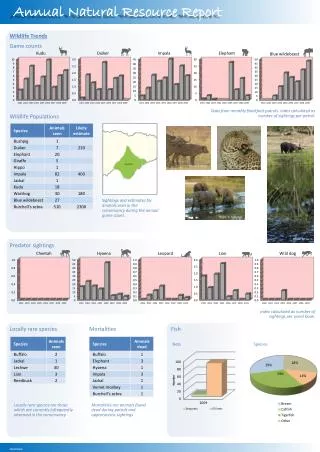
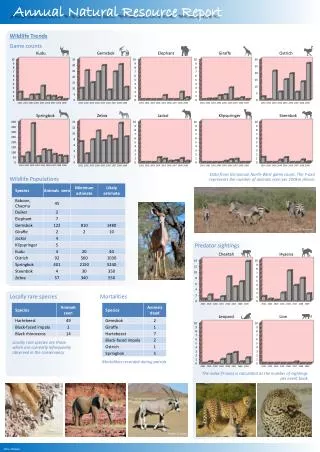
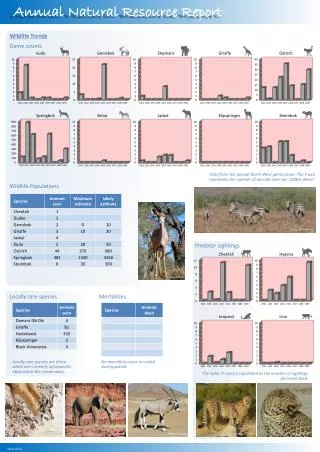
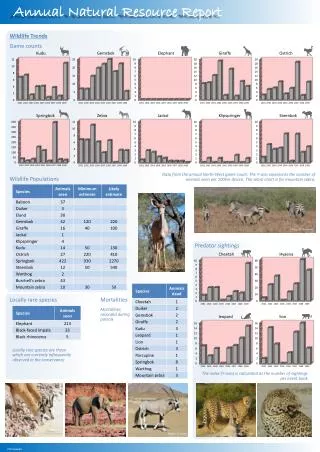
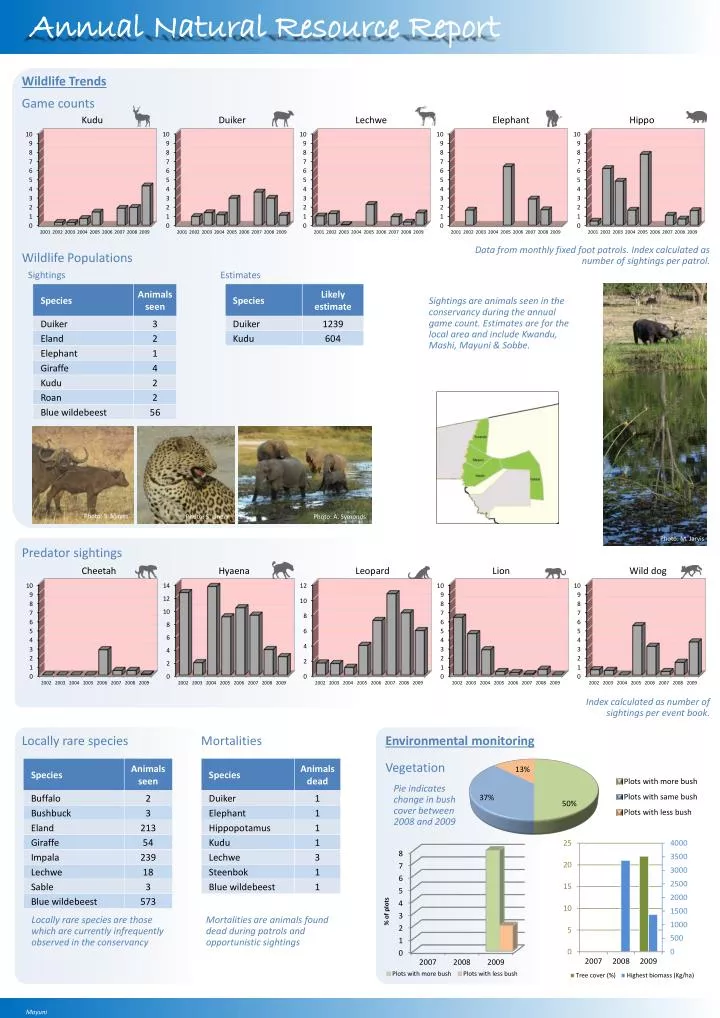
Annual Natural Resource Report. Wildlife Trends. Game counts . Data from monthly fixed foot patrols. Index calculated as number of sightings per patrol. Wildlife Populations. Sightings. Estimates.

E N D
Annual Natural Resource Report Wildlife Trends Game counts Data from monthly fixed foot patrols. Index calculated as number of sightings per patrol. Wildlife Populations Sightings Estimates Sightings are animals seen in the conservancy during the annual game count. Estimates are for the local area and include Kwandu, Mashi, Mayuni & Sobbe. Photo: S. Mayes Photo: S. Linder Photo: A. Symonds Photo: M. Jarvis Predator sightings Index calculated as number of sightings per event book. Locally rare species Mortalities Environmental monitoring Vegetation Pie indicates change in bush cover between 2008 and 2009 Locally rare species are those which are currently infrequently observed in the conservancy Mortalities are animals found dead during patrols and opportunistic sightings Mayuni
Mayuni - 2009 Wildlife Use Wildlife Income Wildlife Introductions Photo: T. Robertson Threats Natural Resource Management Poaching Human-Wildlife Conflict WeakGood Performance: Incidents Incidents Species 2009 Red bars indicate weak areas in the conservancy management performance which need to be addressed. Green bars indicate positive management performance. Effort: Rainfall (mm) Damage The species chart indicates the most troublesome to least troublesome conflict species in the conservancy. The Y-axis in HWC and poaching charts represents number of incidents. Years with no bars indicate gaps in data collection Mayuni