Download

1 / 12
140 likes | 487 Views
Nonparametric Statistics. aka, distribution-free statistics makes no assumption about the underlying distribution, other than that it is continuous the data can be non-quantitative, rank order, etc. Competitors of the t- and F- procedures we used in chapters 11 and 12.

E N D
Nonparametric Statistics aka, distribution-free statistics makes no assumption about the underlying distribution, other than that it is continuous the data can be non-quantitative, rank order, etc. Competitors of the t- and F- procedures we used in chapters 11 and 12. generally less efficient, require larger sample sizes for the same confidence level and power
Source: Gerard E. Dallal, Ph.D., Nonparametric Statistics. http://www.jerrydallal.com/LHSP/npar.htm
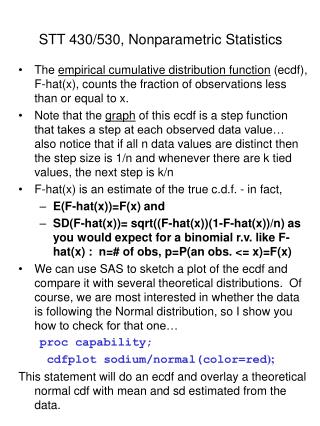
Test of the median: the Sign Test • Tests hypotheses about the median of a continuous distribution, i.e., • Recall that the median is that value for which • Therefore, the sign test looks at the number of values above (R+) and below (R-) the hypothesized median. When the null hypothesis is true, R = min(R+, R-) follows the binomial distribution with sample size n and p = 0.5, i.e.
An example: • Recall the example comparing two methods for testing shear strength in steel girders. Suppose we are interested in testing whether or not the actual median of the Karlsruhe method is 1.2, that is … given the data as shown on pg 293 and in the Excel data file. • Note the difference between the algorithm given in the textbook (as done in Excel) and the results from Minitab …
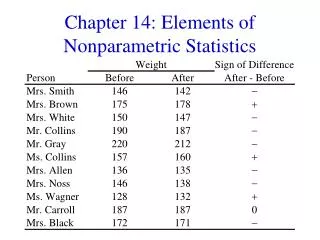
Same as for single samples, but the null hypothesis is that the median difference = 0, i.e. Example, paired comparison of example 11-17 ignoring the normality assumption … Calculate P-value as the probability that number of data points is less than or equal to the minimum R value given a binomial distribution with p = 0.5, i.e. The Sign Test for paired samples
Recall that βis the probability of a Type II error, i.e. This is highly dependent on the shape of the underlying distribution see, for example, the example on pg. 491 of your textbook Determining β
Wilcoxon signed rank test Sign test only focuses on whether the data are above or below the presumed median, ignoring the magnitude If we assume a symmetrical continuous distribution, we can use the Wilcoxon signed rank test Similar to the sign test, but now we order the differences from the mean in order of magnitude and add the ranks together. Let’s do this once on Excel and once on Minitab. (Note the differences!)
Large sample approximation Given n >20, then it can be shown that R is approximately normally distributed with and a test of H0: µ = µ0 can be based on the statistic
Comparing 2 means: Wilcoxon rank sum Order all data from lowest to highest, keeping up with which data point belongs to which group For example, see example 16-5, pg 500 Then, R1=sum(rankorder for sample 1) and R2=sum(rankorder for sample 2) From table IX, obtain R*αfor n1 and n2 atαof 0.01 and 0.05 Alternatively, using Mann-Whitney on Minitab … 9 ETM 620 - 09U
Large sample approximation Given n1 and n2 >8, then it can be shown that R1 is approximately normally distributed with and a test of H0: µ1 = µ2 can be based on the statistic
Expands the rank-sum method to more than one factor level Use Minitab to perform the statistical analysis … Look at example 16-6, pg. 503 Analysis of Variance: the Kruskal-Wallis Test
Other nonparametric tests … Mood’s Median Test similar to Kruskal-Wallis, more robust against outliers but less robust when samples are from different distributions Friedman Test test of the randomized block design (nonparametric equivalent to the two-way ANOVA) Runs test checks for data runs (> expected number of observations above or below the median)