Download
1 / 11
110 likes | 214 Views
Health and Medical Services Plan and Implementation Capability. Nighttime Injuries vs. Hospital Functionality. 5-State Region Number of Nighttime Injuries by Severity Basic Medical Aid: 2,810 Non-Life Threatening: 480 Life Threatening: 84 Fatal: 50.

E N D
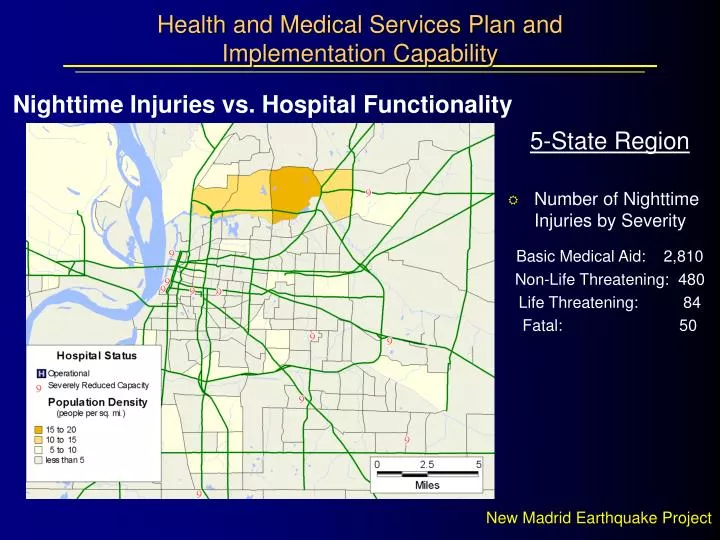
Health and Medical Services Plan andImplementation Capability Nighttime Injuries vs. Hospital Functionality 5-State Region • Number of Nighttime Injuries by Severity Basic Medical Aid: 2,810 Non-Life Threatening: 480 Life Threatening: 84 Fatal: 50
Transportation Plan and Implementation Strategy Emergency Route Planning: Population vs. Route Capacity Greater Memphis Region • Approx. 800,000 nighttime residents plus emergency personnel • 50,000 vehicles/day average capacity for 430 area bridges
Transportation Plan and Implementation Strategy Emergency Route Planning: Scenario Impact on Bridges Greater Memphis Region • Approx 15% of Bridges Operational • 10 Operational • 47 Operational w/ Damage • 16 Restored w/in 30 Days • 365 Restored after 30 Days • Surface Streets most viable Alternate Routes • Majority of 5-State Region Bridges are Undamaged
Housing Recovery Strategy Displaced Households and Shelter Locations 5-State Region • Displaced Households: 11,667 • Shelter Locations (Schools) • Available: 549 • Unavailable: 329 • Nearest Available School is 15 mi. from Epicenter
Housing Recovery Strategy Households without Water or Power 5-State Region • Total Households:700,000 • Households Without Water:320,000 • Households Without Power:469,000
Emergency Management Assistance Compact Functionality: Emergency Response, Aircraft and Communications Facilities Emergency Response Communications Aircraft Facilities
Post-Disaster Building Inspection Capability Projected No. of Yellow Tagged Structures 5-State Region • Total Structures: 625,000 • Yellow Tags: 107,000 (17%) • Yellow Tags - Moderately to Extensively Damaged, Limited Access
Post-Disaster Building Inspection Capability Projected No. of Red Tagged Structures 5-State Region • Total Structures: 625,000 • Red Tags: 25,000 (4%) • Red Tags - Extensive to Completely Damaged, Access Prohibited
Post-Disaster Building Inspection Capability Estimated Amount of Debris Generated 5-State Region • Total:4.7 Million tons • Brick/Wood:2.5 Million tons • Steel/Concrete:2.2 Million tons • Max. Debris in a Single Tract:130,000 tons
HAZUS Applications General Building Stock Losses (by distance from source, $Millions) Residential: Commercial: Industrial: Total: Within 40 mi.Over 40 mi. $ 7,400 (21%) $120 $ 5,000 (58%) $ 70 $ 320 (13%) $ 10 $13,800 (29%) $230 Total Building Stock Loss: $14 Billion (17%)
HAZUS Applications Dam Inundation Potential 5-State Region • Number of Dams:953 • Number of High1 Hazard Dams by Shaking Intensity: • Light: 7 • Moderate: 45 • Considerable: 18 • Strong: 16 • Severe: 19 • Violent: 5 1USACE Hazard Classification