Download
1 / 8
80 likes | 86 Views
Cohesive soils are well known for their low strength properties. Thus, they are inappropriate for geotechnical works. Soils may be stabilized to increase strength and durability. Stabilization with cement is a common treatment technology. The present study examines the strength of cement stabilized soil. The laboratory tests were carried out in order to study the strength of california bearing ratio CBR . Nine clayey soils with different properties were mixed with various amounts of cement content 3, 6, 9 and 12 and compacted at the optimum moisture content and maximum dry density. Soaked or unsoaked condition of soil affects the CBR value. The test results show that unsoaked CBR before stabilization ranges between 2.78 and 10.22 which that of its corresponding soaked samples range between 1.01 and 9.5 . After stabilization, the values of unsoaked CBR range between 3.08 and 47 . The maximum values of unsoaked CBR are within 10.8 to 47 . So it can be used as sub base condition. The conventional CBR testing method is expensive and time consuming. The laboratory test results were used for the development of regression based model to predict unsoaked and soaked CBR values for natural and cement stabilized soil. Aye Aye Myat | Nyan Myint Kyaw | Htay Win "Prediction Models for Estimation of California Bearing Ratio for Cohesive Soil" Published in International Journal of Trend in Scientific Research and Development (ijtsrd), ISSN: 2456-6470, Volume-2 | Issue-3 , April 2018, URL: https://www.ijtsrd.com/papers/ijtsrd12819.pdf Paper URL: http://www.ijtsrd.com/engineering/civil-engineering/12819/prediction-models-for-estimation-of-california-bearing-ratio-for-cohesive-soil/aye-aye-myat<br>

E N D
International Research Research and Development (IJTSRD) International Open Access Journal iction Models for Estimation of California Bearing Ratio for Cohesive Soil California Bearing Ratio for Cohesive Soil International Journal of Trend in Scientific Scientific (IJTSRD) International Open Access Journal ISSN No: 2456 ISSN No: 2456 - 6470 | www.ijtsrd.com | Volume 6470 | www.ijtsrd.com | Volume - 2 | Issue – 3 Prediction Models for Estimation of California Bearing Ratio for Cohesive Soil Aye Aye Myat Aye Aye Myat1, Nyan Myint Kyaw2, Htay Win3 1Ph.D Student, Ph.D Student, 2Professor and Head, 3Associate Professor Department of Civil Engineering, Yangon Technological University, Myanmar Department of Civil Engineering, Yangon Technological University, Myanmar Department of Civil Engineering, Yangon Technological University, Myanmar ABSTRACT Cohesive soils are well known for their low strength properties. Thus, they geotechnical works. Soils may be stabilized to increase strength and durability. Stabilization with cement is a common treatment technology. The present study examines the strength of cement stabilized soil. The laboratory tests were carried out in order to study the strength of california bearing ratio (CBR). Nine clayey soils with different properties were mixed with various amounts of cement content (3, 6, 9 and 12%) and compacted at the optimum moisture content and maximum dry density. Soaked or unsoaked condition of soil affects the CBR value. The test results show that unsoaked CBR before stabilization ranges between 2.78% and 10.22% which that of its corresponding soaked samples range between 1.01% and 9.5%. After stabilization, the values of unsoaked CBR range between 3.08% and 47%. The maximum values of unsoaked CBR are within 10.8% to 47%. So it can be used as sub condition. The conventional CBR testing method is expensive and time consuming. The laboratory test results were used for the development of regression based model to predict unsoaked and soaked CBR values for natural and cement stabilized soil. Keywords: cohesive soils, cement, CBR, model I. INTRODUCTION Cohesive soils are well known for their low strength properties. Thus, they geotechnical works. Soils may be stabilized to increase strength and durability. Stabilization with cement is a common treatment technology. The examines the strength of cement stabilized soil. The laboratory tests were carried out in order to study the strength of california bearing ratio (CBR). Nine clayey soils with different properties were mixed with various amounts of cement content and 12%) and compacted at the optimum moisture content and maximum dry density. Soaked or unsoaked condition of soil affects the CBR value. to differential settlements, poor shear strength and high compressibility. Improvement of load bearing capacity of the soil may be undertaken by a variety of ground improvement techniques like stabilization of soil, adoption of reinforced earth technique e soil, adoption of reinforced earth technique etc. to differential settlements, poor shear strength and high compressibility. Improvement of load bearing capacity of the soil may be undertaken by a variety of ground improvement techniques like stabilization of are are inappropriate inappropriate for for Soil improvement could either be by modification or stabilization or both. Soil modification is the addition of a modifier (cement, lime etc.) to a soil to change its index properties, while soil stabilization is the treatment of soils to enable their durability to be improved such that they become totally suitable for construction beyond their original classification. Over the times, cement and lime are the two main materials used for stabilizing soils. The role of cement is to bind soil particles together, improve compaction and the engineering properties of available soil such as, unconfined compressive strength, workability, swelling sensitivity to changes in moisture content. Soil stabilization with cement is widely used foundations of structures, in basement improvement, in rigid and flexible highway, airfield pavements, waterproofing and reservoir and channel linings [7]. Cement is the oldest binding agent since the invention of soil stabilization technology considered as primary stabilizing agent or hydraulic binder because it can be used alone to bring about the stabilizing action required [8]. The overall objective of this research is to study the compaction and strength of cement treated soils. The specific objectives of the study are investigation of the physical and mechanical properties of natural and physical and mechanical properties of natural and Soil improvement could either be by modification or stabilization or both. Soil modification is the addition of a modifier (cement, lime etc.) to a soil to change its index properties, while soil stabilization is the treatment of soils to enable their strength and durability to be improved such that they become totally suitable for construction beyond their original classification. Over the times, cement and lime are the two main materials used for stabilizing soils. The role particles together, improve compaction and the engineering properties of available soil such as, unconfined compressive strength, workability, swelling sensitivity to changes in moisture content. Soil stabilization with cement is widely used to improve foundations of structures, in basement improvement, in rigid and flexible highway, airfield pavements, waterproofing and reservoir and channel linings [7]. unsoaked CBR before stabilization ranges between 2.78% and 10.22% corresponding soaked samples range between 1.01% and 9.5%. After stabilization, the values of unsoaked CBR range between 3.08% and 47%. The maximum values of unsoaked CBR are within 10.8% to 47%. So it can be used as sub-base potential potential and and R testing method is expensive and time consuming. The laboratory test results were used for the development of regression based model to predict unsoaked and soaked CBR values for natural and cement stabilized soil. Cement is the oldest binding agent since the invention of soil stabilization technology in 1960’s. It may be considered as primary stabilizing agent or hydraulic binder because it can be used alone to bring about the stabilizing action required [8]. The overall objective of this research is to study the compaction and cohesive soils, cement, CBR, regression Construction of building and other civil engineering structures on weak or soft soil is highly risky on geotechnical grounds because such soil is susceptible geotechnical grounds because such soil is susceptible Construction of building and other civil engineering structures on weak or soft soil is highly risky on ed soils. The specific objectives of the study are investigation of the @ IJTSRD | Available Online @ www.ijtsrd.com @ IJTSRD | Available Online @ www.ijtsrd.com | Volume – 2 | Issue – 3 | Mar-Apr 2018 Apr 2018 Page: 2594
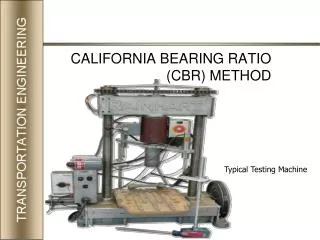
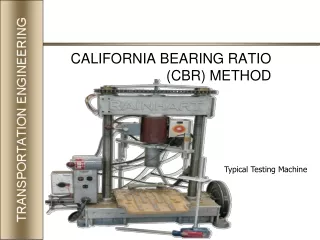
International Journal of Trend in Scientific Research and Development (IJTSRD) ISSN: 2456-6470 cement treated soils; investigation of the compaction characteristics of cement interpretation of the effect of cement content on strength for various soils stabilized with cement. The conventional CBR testing method is expensive and time consuming. To conduct CBR test on cement stabilized soil, a remoulded specimen is prepared and compacted at optimum moisture content. CBR test in laboratory requires a large soil sample and time consuming. To overcome this situation, it is better to predict CBR value of cement stabilized soil with easily determinable parameters. II. LITERATURE REVIEW Dr. Dilip Kumar Talukdar. conducted studies on “A Study of Correlation between California Bearing Ratio (CBR) Value with Other Properties of Soil”. From this study, the following conclusions can be made. CBR value of fine grained soil (ML and MI) bears significant correlation with PI, MDD and OMC. CBR value decreases with the increase in the plasticity index and optimum moisture content of soil but increases with the increase in the maximum dry density. There is a slight difference between the CBR value determined in the laboratory and computed by using multiple linear regression model involving LL, PL, PI, MDD and OMC [11]. Ramasubbarao, G.V. and Siva Sankar, G conducted studies on “Predicting Soaked CBR Value of Fine Grained Soils Using Index and Compaction Characteristics” The following conclusions can be drawn. The statistical parameters indicate that the model developed by Simple Linear Regression Analysis (SLRA) for correlating soaked CBR value with Maximum Dry Density (MDD) has shown better performance. The other models developed by SLRA for correlating soaked CBR value with P.L, %Fines (F), %Sand (S), L.L and OMC have shown relatively good performances. The statistical parameters indicate that better performance can be obtained from the model developed using Multiple Linear Regression Analysis (MLRA) by showing the highest R-value of 0.96 and R2- value of 0.92 and the lowest error of 0.97. It was observed that the use of index properties such as grain size analysis, plasticity characteristics and compaction characteristics appears to be reasonable in the estimation of soaked CBR value of fine grained soils [12]. Naveen B Shirur, Santosh G Hiremath conducted studies on “Establishing Relationship between CBR Value and Physical Properties of Soil”. The following conclusion can be drawn. Based on experimental results and SLRA, there is no significant relation exists to predict CBR value from liquid limit and plastic limit. Linear relation exists to predict CBR value from plasticity index, MDD and OMC. The empirical relation obtained from multiple linear regression analysis (MLRA) shows good relation to predict CBR value from MDD and OMC. From the correlation analysis it is clear that, large variation can be observed between experimental and predicted CBR value particularly in case of high compressible clays (CH) [13]. treated soils and Underlying soils are an essential component of pavement structures, and performance is the cause of many premature pavement failures. Clayey soils in particular may provide inadequate support, particularly when saturated. Soils with significant plasticity may also shrink and swell substantially with changes in moisture conditions. These changes in volume can cause the pavement to shift or heave with changes in moisture content, and may cause a reduction in the density and strength of the subgrade, accelerating pavement deterioration. There is a substantial history of use of soil stabilization admixtures to improve poor soil performance by controlling volume change and increasing strength. Lime and cement have been used successfully for many decades [9]. inadequate strength Asma, U.H., Rafizul, I.M., Hasibul, M.H., Roy, S., Didarul, M. AND Shohel, M.R. 2013 conducted studies on “Engineering Behavior of Cement Stabilized Soil: New Statistical Model.” In this study soft soil was stabilized with cement at five contents and curing was done for 3, 7, 28 and 90 days. Result reveals that compressive strength increases with the increase of cement content and curing period. However, liquid limit has decreased with the increasing curing days but it has increased with the increasing cement content. Again, water content is decreasing with the increasing curing days and cement content. Based on SPSS analysis it is seen that regression model for 7 days is not acceptable to the desired confidence level with the obtained data. Regression model for 3 and 28 days is acceptable as it reached the desired confidence level. So, these obtained results from various tests and SPSS analysis on this cement stabilized soil can be used for further research and also for field application [10]. @ IJTSRD | Available Online @ www.ijtsrd.com | Volume – 2 | Issue – 3 | Mar-Apr 2018 Page: 2595
International Journal of Trend in Scientific Research and Development (IJTSRD) ISSN: 2456-6470 TABLE 2 a: PHYSICAL PROPERTIES OF NATURAL SOILS Location S-1A S-1B Specific gravity L.L 34.25 34.35 P.L 14.60 17.80 S.L 14.72 24.39 P.I 19.65 16.55 Gravel(%) 4.64 0.00 Sand (%) 20.38 17.32 Silt (%) 26.98 55.68 Clay (%) 48.00 27.00 R200 25.02 17.32 Group Symbol Lean Clay with sand Sand TABLE 2b: PHYSICAL PROPERTIES OF NAURAL SOILS Location S-3A S-3B Specific gravity L.L 45.25 48.80 68.10 54.05 64.90 P.L 22.43 17.42 25.29 20.63 23.35 S.L 22.20 21.59 17.68 19.86 15.34 P.I 22.82 31.38 42.81 33.42 41.55 Gravel(%) 1.00 0.17 Sand (%) 7.48 11.26 1.18 Silt (%) 62.52 44.57 50.82 73.32 68.32 Clay (%) 29.00 44.00 48.00 18.50 31.00 R200 8.48 11.43 1.18 Group Symbol Group Name Clay Clay Testing Procedures Laboratory tests were conducted to observe the basic index, unsoaked and soaked California Bearing Ratio (CBR) on unstabilized and stabilized soils according to ASTM standards. The unstabilized and stabilized with 3%, 6% , 9% and 12% cement content soil samples were prepared for compaction test. And then unsoaked and soaked CBR tests were conducted on each soil sample at the optimum moisture content. The laboratory test results were used for the development of regression based model to predict III. MATERIAL AND METHOD A. Speciation of Soils S-2A S-2B In this study, clayey soils were collected locally from Yangon and Ayeyarwaddy Division. Nine clayey soil samples with different plasticity indices were used in this experimental study. Soil locations and notation for present study are shown in Table 1. Soil samples were taken by using disturbed sampling method. The collected soils were hard and it was pulverized manually by hammer. Then the soils were screened through the sieve of 4.75 mm openings before preparing the specimens for testing. And then, physical properties of cohesive soil such as gravel, sand, silt and clay content, liquid limit (L.L), plastic limit (P.L), shrinkage limit (S.L), swelling potential, water content and specific gravity were tested. TABLE 1: SOIL LOCATIONS AND NOTATION No. Location 1 South Oakkalapa 2 Shan Su 3 Yankin 4 Lanmataw 5 Dawpon 6 Thar Kay Ta 7 Kaukas 8 North Oakkalapa Hinthada-Sone Aung Atterberg limit test and sieve analyses of clayey soils were carried out according to ASTM D4318 and ASTM D422-63 respectively. Soil type and classification were performed based on USCS (ASTM D2487). The properties of the tested soils are given in Table 2a and Table 2b. 2.52 2.64 2.65 2.65 24.25 11.65 37.61 12.60 0.00 48.73 38.77 12.50 48.73 20.75 9.44 14.92 11.31 10.94 27.34 43.72 18.00 38.28 CL CL CL CL Lean Clay with Sandy Lean Clay Sandy Lean Clay Group Name Notation S-1A S-1B S-2A S-2B S-3A S-3B S-4A S-4B S-4A S-4B S-4C 2.69 2.56 2.58 2.68 2.56 0.00 0.18 8.00 0.02 0.66 Kone-Myan 9 S-4C 8.18 0.68 CL CL CH CH CH Lean Lean Fat Clay Fat Clay Fat Clay @ IJTSRD | Available Online @ www.ijtsrd.com | Volume – 2 | Issue – 3 | Mar-Apr 2018 Page: 2596
International Journal of Trend in Scientific Research and Development (IJTSRD) ISSN: 2456-6470 unsoaked and soaked CBR values for natural and cement stabilized soil. RESULTS AND DISCUSSIONS 9 82.2 71.52 10.68 A.Atterberg Limit Test of Soil Samples Atterberg limit test for clayey soils will be carried out according to ASTM D4318. The results of various soil samples are shown in Table 3 and Fig. 1. According to Fig. 1, plasticity index of cement stabilized soils decrease with the increase of cement content for S-1B, S-2B and S-3B. The P.I values for other soil types are the highest at 3% cement content and then decrease with the increase of cement content. A reduction in plasticity index causes a significant decrease in swell potential and removal of some water that can be absorbed by clay minerals. TABLE 3: ATTERBERG RESULTS FOR STABILIZED SOIL SAMPLES Cement Content (%) S-1A 3 50.8 6 45.7 9 42 S-1B 3 36.8 6 40.7 9 36.5 12 42 S-2A 3 29.5 6 24.7 9 0 S-2B 3 0 6 0 9 0 S-3A 3 56 6 53.2 9 53.2 S-3B 3 48 6 52 9 47 12 45 S-4A 3 75 6 52 9 55.8 S-4B 3 81.8 6 62 9 59.5 S-4C 3 83.5 6 74.2 Fig. 1 Variation of Plasticity Index with Cement Content B.Compaction Test Compaction test (ASTM D1557) was performed on the unstabilized and stabilized soil samples to determine their engineering laboratory conditions. The results of compaction test for various soil types are shown in Table 4, Fig. 2 and Fig.3. Fig 2 shows the relationship between cement content and optimum moisture content (OMC). From this figure, OMC values are not the same with the addition of cement content. According to comparison of OMC with PL, OMC is smaller than PL. Fig. 3 shows the relationship between cement content and maximum dry density (MDD). MDD values are decreased with the addition of cement content except fat clay (S-4A, S-4B and S-4C). MDD values for fat clay are the highest in 9% cement content. TABLE 4: COMPACTION TEST RESULTS FOR UNSTABILIZED AND STABILIZED SOIL SAMPLES Cement Content (%) S-1A 0 LIMIT TEST properties under Soil Type L.L (%) P.L (%) P.I (%) 18.53 20.94 23.92 24.98 24.73 26.43 27.30 15.17 12.87 0 0.00 0.00 0.00 24.02 28.87 31.87 25.44 27.14 23.07 24.00 25.42 28.58 33.65 28.79 35.75 34.60 37.99 41.85 32.27 24.76 18.08 11.82 15.97 10.07 14.70 14.33 11.83 0 0.00 0.00 0.00 31.98 24.33 21.33 22.56 24.86 23.93 21.00 49.58 23.42 22.15 53.01 26.25 24.90 45.51 32.35 Soil Type OMC (%) MDD (lb/ft3) 16.8 110.47 3 13.3 103.4 6 17.4 108.06 9 14.5 108.5 S-1B 0 17.5 100.3 3 20.5 100 6 21 99.7 9 18 98.4 12 17.8 97.5 @ IJTSRD | Available Online @ www.ijtsrd.com | Volume – 2 | Issue – 3 | Mar-Apr 2018 Page: 2597
International Journal of Trend in Scientific Research and Development (IJTSRD) ISSN: 2456 International Journal of Trend in Scientific Research and Development (IJTSRD) ISSN: 2456 International Journal of Trend in Scientific Research and Development (IJTSRD) ISSN: 2456-6470 S-2A 0 10.8 118.4 118.4 3 13 111.3 111.3 6 11 112.8 112.8 9 13.7 114.08 114.08 S-2B 0 12 118.5 118.5 3 12 113 113 6 12 116 116 9 12.9 116.5 116.5 Fig. 2 Relationship between Cement Content and Fig. 2 Relationship between Cement Content and Optimum Moisture Content S-3A 0 23.7 96.05 96.05 3 23 93.1 93.1 140 S-1A Maximum Dry Density (lb/in2) 6 20 94 94 120 S-1B 100 9 20 94.97 94.97 S-2A 80 S-3B 0 19 102.3 102.3 S-2B 60 S-3A 3 18.5 102 102 40 S-3B 20 S-4A 0 6 17 102.2 102.2 S-4B 0 3 6 9 12 Cement Content (%) S-4C 9 17.5 101.83 101.83 12 17 100.5 100.5 Fig. 3 Relationship between Cement Content and Fig. 3 Relationship between Cement Content and Maximum Dry Density Maximum Dry Density S-4A 0 26.5 83.79 83.79 C. The California Bearing Ratio (CBR) test is commonly used to determine the suitability of a soil as a subgrade or subbase for highway and runway design and construction. From Fig 4, natural soil is too small in unsoaked CBR values except S stabilized with cement to increase strength and to be able to use road construction instead of conventional material by reducing road thickness. These stabilized soils compacted with optimum moisture content are tested for CBR. Table 5, Fig 4 and Fig 5 sh results of unsoaked and soaked CBR values for various soil types with different cement contents. 3 24.2 88.4 88.4 California Bearing Ratio Test (CBR) California Bearing Ratio Test (CBR) The California Bearing Ratio (CBR) test is commonly used to determine the suitability of a soil as a subgrade or subbase for highway and runway design and construction. From Fig 4, natural soil is too small in unsoaked CBR values except S-2A. So, soils are stabilized with cement to increase strength and to be able to use road construction instead of conventional material by reducing road thickness. These stabilized soils compacted with optimum moisture content are tested for CBR. Table 5, Fig 4 and Fig 5 show the results of unsoaked and soaked CBR values for various soil types with different cement contents. 6 23 93.51 93.51 9 12.6 93.9 93.9 S-4B 0 24.8 94.2 94.2 3 20.50 94.9 94.9 6 16.11 93.84 93.84 9 18.58 95.8 95.8 S-4C 0 24.5 93 93 3 7.6 90.91 90.91 6 12 90.5 90.5 9 8.2 94.57 94.57 @ IJTSRD | Available Online @ www.ijtsrd.com @ IJTSRD | Available Online @ www.ijtsrd.com | Volume – 2 | Issue – 3 | Mar-Apr 2018 Apr 2018 Page: 2598
International Journal of Trend in Scientific Research and Development (IJTSRD) ISSN: 2456-6470 TABLE 5. UNSOAKED AND SOAKED CBR RESULTS FOR UNSTABILIZED STABILIZED SOIL SAMPLES Cement Content (%) S-1A 0 3 6 9 S-1B 0 3 6 9 12 S-2A 0 3 6 9 S-2B 0 3 6 9 S-3A 0 3 6 9 S-3B 0 3 6 9 12 S-4A 0 3 6 9 S-4B 0 3 6 9 S-4C 0 3 6 9 AND Unsoaked CBR (%) Soaked CBR (%) Soil Type 2.83 21 35.33 16.29 3.30 3.08 6.4 10.8 4.97 10.22 26.33 47.00 27.38 2.78 32.5 11.82 13.53 3.33 12.67 21.11 14.84 4.19 10.27 11.00 12.4 8.68 3.50 10.00 18.00 16.29 2.83 13.56 9.73 11.45 2.81 16.25 12.81 15.81 3.33 42.00 105.22 48.87 2.01 4.56 17.4 49.55 29.73 9.5 94.33 105.00 82.14 2.22 66.2 85.26 127.83 2.67 19.33 40.83 32.79 3.71 27.79 43.65 93.4 74.72 2.00 11.83 32.00 42.27 3.00 12.63 12.15 54.05 1.01 5.19 12.45 30.75 Fig. 4 Effect of Cement content on Unsoaked CBR 140 S-1A 120 S-1B Soaked CBR (%) 100 S-2A 80 S-2B 60 S-3A 40 S-3B 20 S-4A 0 S-4B 0 3 Cement Content (%) 6 9 12 S-4C Fig. 5 Effect of Cement content on Soaked CBR D.Proposed Model for Estimating CBR Values In this study, multiple liner regression analysis (MLRA) was developed for estimating unsoaked and soaked CBR values in terms of cement content (CC), liquid limit (LL) and optimum moisture content (OMC). MLRA has been carried out by considering unsoaked and soaked CBR values as the independent variable and the rest of soil properties as dependent variables. MLRA can be carried out using standard statistical software like SPSS. Table 6and Table 7 shows the summary of the computation of linear regression equations for different condition of test results. TABLE 6. LINEAR REGRESSION EQUATIONS FOR UNSOAKED AND SOAKED CBR VALUES (NATURAL SOIL) No Linear Equations CBRunso = 13.793 + 0.291LL - 1.114OMC CBRso = 9.103 - 0.286OMC Regression R2 R Sig. 1 0.72 0.52 0.05 2 0.65 0.43 0.03 @ IJTSRD | Available Online @ www.ijtsrd.com | Volume – 2 | Issue – 3 | Mar-Apr 2018 Page: 2599
International Journal of Trend in Scientific Research and Development (IJTSRD) ISSN: 2456-6470 TABLE 7. LINEAR REGRESSION EQUATIONS FOR UNSOAKED AND SOAKED CBR VALUES (CEMENT STABILIZED SOIL) No. Linear Equations CBRunso = 18.839 + 1.16CC - 0.634OMC CBRso = 30.665 + 4.102CC - 1.148OMC 0.72 0.51 0.012 E. Validity of the Proposed Model The validity of the proposed model for prediction of unsoaked and soaked CBR values was verified by the results of few researchers. The results of the predicted and observed unsoaked and soaked CBR values for natural soil are shown in Table 8 and that for cement stabilized soil are presented in Table 9. The results of the analysis indicate that there is a close relationship between CBR values, Compaction and index properties. There is a slight difference between the observed and predicted CBR value by using multiple linear regression model involving CC, LL and OMC. Regression analysis provides a sound background for preliminary assessment of CBR values. CONCLUSIONS TABLE 9. VALIDITY OF PROPOSED MODEL FOR UNSOAKED AND SOAKED CBR VALUES (CEMENT STABILIZED SOIL) Researcher Lel Myat Thu CC (%) 4 OMC (%) 26.7 Predicted Value Soak 16.42 24.28 33.06 38.39 Observed Value Soak 15.2 Ratio of Predicted to Observed stabilized soils decrease with the increase of cement content for S-1B, S-2B and S-3B. The P.I values for other soil types are the highest at 3% cement content and then decrease with the increase of cement content. (2) The values of MDD decrease with the increase of cement content except S-4 group. The values of OMC decrease with the increase of cement content for S-3 group and S-4 group. For S-1 and S-2 group, these values are the highest at 6% and 9% cement content respectively and then gradually decrease with the increase of cement content. (3) CBR (unsoaked) values are the highest at 3% cement content for S-2B, S-4B, S-4C, at 6% cement content for S-1A, S-2A, S-3A, S-4A and at 9% cement content for S-1B, S-3B. The maximum values of unsoaked CBR are within 10.8% to 47%. So it can be used as sub-base condition. CBR (soaked) values are the highest at 6% cement content for S-1A, S-2A, S-3A, S-4A and at 9% cement content for other soil types. (4) The results of the analysis indicate that there is a close relationship between CBR values, Compaction and index properties. There is a slight difference between the CBR value determined in the laboratory and computed by using multiple linear regression model involving LL and OMC. Regression analysis provides a sound background for preliminary assessment of CBR values. Regression R2 R Sig. 6 27 8.68 8 26.5 11.31 12.05 10 29 1 0.70 0.49 0.01 Unsoak 6.55 2 Unsoak 10.8 12.2 27.6 0.71 14.3 52.3 0.79 12.5 59.8 0.96 Unsoak 0.61 1.08 0.88 0.63 0.64 Soak This study presented the effect of cement content on geotechnical properties and proposed models for untreated and treated soil samples. The results of the study are presented in the following. (1) Soils with liquid limit less than 50% are considered to be CL and those with liquid limit greater than 50% exhibit CH according to USCS. Plasticity index of cement TABLE 8. VALIDITY OF PROPOSED MODEL FOR UNSOAKED AND SOAKED CBR VALUES (NATURAL SOIL) Lel Myat Thu LL (%) 41 OMC (%) 16.3 Predicted value Soak 4.44 Observed value Soak 3.1 Ratio of Predicted to Observed Saw Kaythi Maung 59.2 21.5 7.07 2.95 7 2.6 1.01 Researcher 7.57 Unsoak 10.7 Unsoak 0.71 Unsoak 1.4 1.1 Soak @ IJTSRD | Available Online @ www.ijtsrd.com | Volume – 2 | Issue – 3 | Mar-Apr 2018 Page: 2600
International Journal of Trend in Scientific Research and Development (IJTSRD) ISSN: 2456-6470 9.Jyoti S.Trivedi , Sandeep Nair Chakradhar Iyyunni “Optimum Utilization of Fly Ash for Stabilization of Sub-Grade Soil using Genetic Algorithm” University Faculty of Technology, K.L.Campus, India ACKNOWLEDGEMENT Firstly, the author gratefully acknowledges her teachers of Department of Civil Engineering, Yangon Technological University. Mainly, the author would like to express her great thankful to Dr. Nyan Myint Kyaw, Professor and Head and U Htay Win, Associate Professor, Engineering, Yangon Technological University for their invaluable suggestions and guidance. And then, she would like to express deep gratitude to Naypyitaw Development Committee for all kinds of support during research project and compilation of the thesis. Then she goes to her family who nurtured a love of learning in her and made education assessable. 10.Asma, U.H., Rafizul, I.M., Hasibul, M.H., Roy, S., Didarul, M. and Shohel, M.R. 2013. “Engineering Behavior of Cement Stabilized Soil: New Statistical Model.” Department of Civil Engineering, Khulna University of Engineering & Technology (KUET), Khulna, Bangladesh Department of Civil 11.Dr. Dilip Kumar Talukdar. “A Study of Correlation between California Bearing Ratio (CBR) Value With Other Properties of Soil” Civil Engineering Department, Nowgong Polytechnic, Nagaon, Assam. India. REFERENCES 1.Bowles, J.E. 1997. Foundation Analysis and Design. Fifth Edition, McGraw-Hill Book Company, United States of America 12.Ramasubbarao, G.V. and Siva Sankar, G “ Predicting Soaked CBR Value of Fine Grained Soils Using Index Characteristics” Department of Civil Engineering, S.R.K. Institute of Technology, India. and Compaction 2.Das, B.M. 2006. Principle of Foundation Engineering. Seventh Edition, Nelson, Cengage Learning in Canada by Nelson Education Ltd, United States of America 13.Naveen B Shirur, Santosh G Hiremath, “ Establishing Relationship between CBR Value and Physical Properties of Soil” Department of Civil Engineering, BEC Bagalkot, India 3.Das, B.M. 2007. Advanced Soil Mechanics. Third Edition, Taylor and Francis Group, London, New York 14.Lei Myat Thu, Ma 2014, “ Study on Stabilized Properties of Some Clayey Soil Treated with Rice Husk Ash and Cement”, Department of Civil Engineering, Yangon Technological University, Myanmar 4.Joaquim P. Marques de Sá, Applied Statistics Using SPSS, STATISTICA, MATLAB and R. Second Edition. 5.Barbara G. Tabachnick.and Linda S. Fidell. Using Multivariate Statistics. Fifth Edition, California State University, Northridge 15.Saw Kay Thi Maung, Ma 2014, “ Study on Strength Characteristics of Some Black Cotton Soil Treated with Wooden Ash as Stabilizer”, Department of Civil Engineering, Yangon Technological University, Myanmar 6.Banita Numerical Investigation into Behaviour of Fly Ash Composite Material in the Sub-base of Surface Coal Mine Haul Road.” Ph.D. Thesis, Department of Mining Engineering, National Institute of Technology, Rourkela - 769 008, India Behera. 2013. “Experimental and 7.Sherwood, P. “Soil stabilization with cement and lime. State of the Art Review” London: Transport Research Laboratory, HMSO, 1993 8.EuroSoilStab. “Development of Design and Construction Methods to Stabilize Soft Organic Soils” Design Guide for soft soil stabilization. CT97-0351, European Commission, Industrial and Materials Technologies Programme (Rite-EuRam III), Bryssel, 2002 @ IJTSRD | Available Online @ www.ijtsrd.com | Volume – 2 | Issue – 3 | Mar-Apr 2018 Page: 2601