Download
1 / 6
60 likes | 65 Views
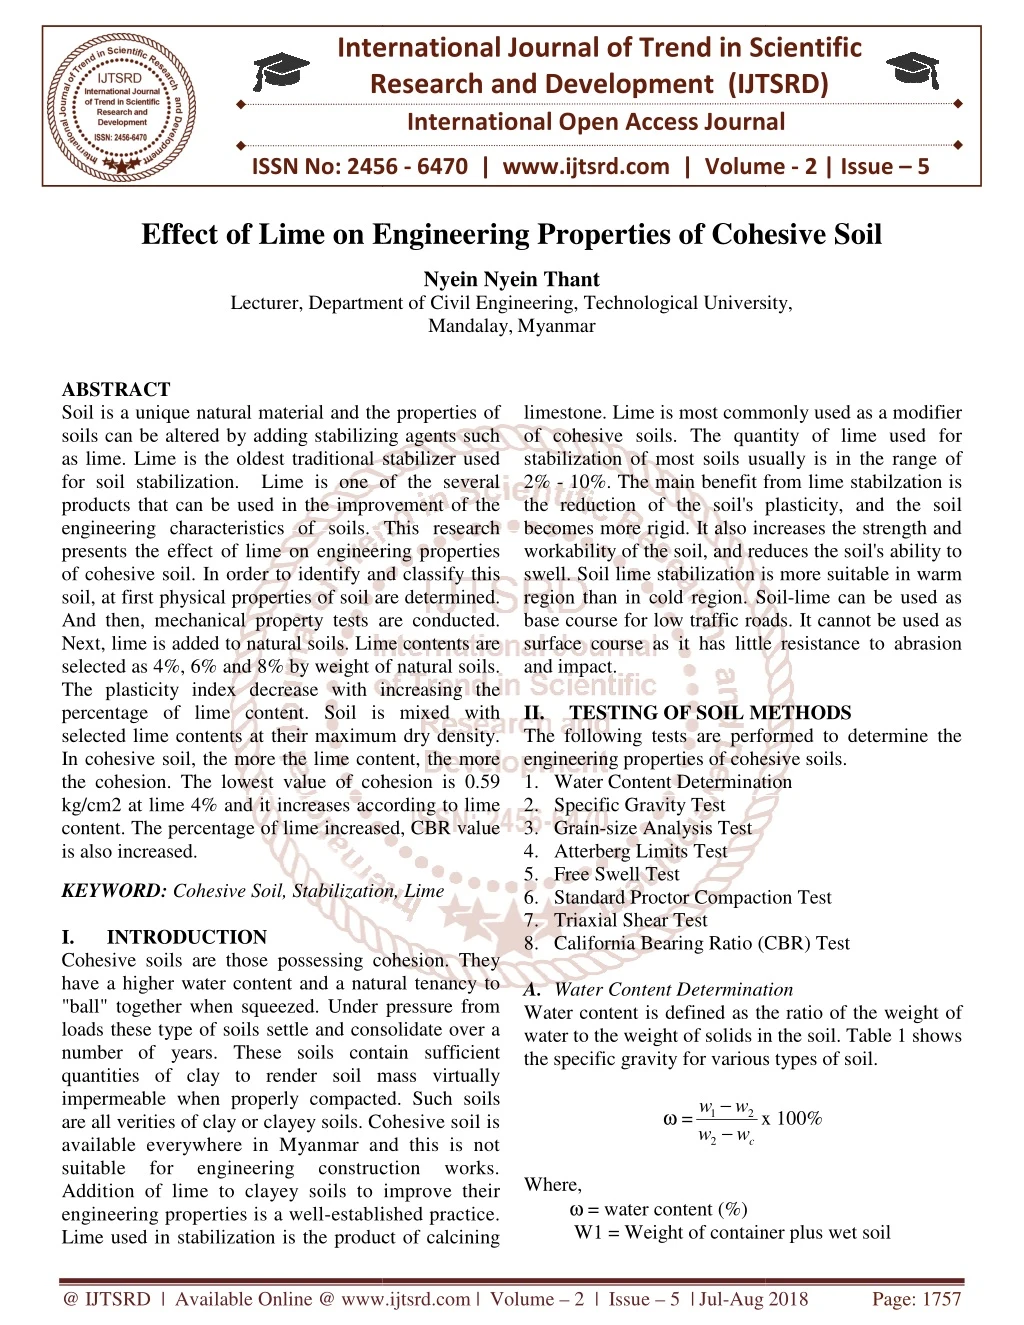
Soil is a unique natural material and the properties of soils can be altered by adding stabilizing agents such as lime. Lime is the oldest traditional stabilizer used for soil stabilization. Lime is one of the several products that can be used in the improvement of the engineering characteristics of soils. This research presents the effect of lime on engineering properties of cohesive soil. In order to identify and classify this soil, at first physical properties of soil are determined. And then, mechanical property tests are conducted. Next, lime is added to natural soils. Lime contents are selected as 4 , 6 and 8 by weight of natural soils. The plasticity index decrease with increasing the percentage of lime content. Soil is mixed with selected lime contents at their maximum dry density. In cohesive soil, the more the lime content, the more the cohesion. The lowest value of cohesion is 0.59 kg cm2 at lime 4 and it increases according to lime content. The percentage of lime increased, CBR value is also increased. Nyein Nyein Thant "Effect of Lime on Engineering Properties of Cohesive Soil" Published in International Journal of Trend in Scientific Research and Development (ijtsrd), ISSN: 2456-6470, Volume-2 | Issue-5 , August 2018, URL: https://www.ijtsrd.com/papers/ijtsrd18162.pdf Paper URL: http://www.ijtsrd.com/engineering/civil-engineering/18162/effect-of-lime-on-engineering-properties-of-cohesive-soil/nyein-nyein-thant<br>

E N D
International Research Research and Development (IJTSRD) International Open Access Journal Effect of Lime on Engineering Properties of Cohesive Soil Nyein Nyein Thant Department of Civil Engineering, Technological University, Mandalay,Myanmar International Journal of Trend in Scientific Scientific (IJTSRD) International Open Access Journal ISSN No: 2456 ISSN No: 2456 - 6470 | www.ijtsrd.com | Volume 6470 | www.ijtsrd.com | Volume - 2 | Issue – 5 Effect of Lime on Engineering Properties of Cohesive Soil Effect of Lime on Engineering Properties of Cohesive Soil Lecturer, Department of Civil Engineering , Technological University, ABSTRACT Soil is a unique natural material and the properties of soils can be altered by adding stabilizing agents such as lime. Lime is the oldest traditional stabilizer used for soil stabilization. Lime is one of the several products that can be used in the improvement of the engineering characteristics of soils. This research presents the effect of lime on engineering properties of cohesive soil. In order to identify and classify this soil, at first physical properties of soil are determined. And then, mechanical property tests are conducted. Next, lime is added to natural soils. Lime contents are selected as 4%, 6% and 8% by weight of na The plasticity index decrease with increasing the percentage of lime content. Soil is mixed with selected lime contents at their maximum dry density. In cohesive soil, the more the lime content, the more the cohesion. The lowest value of cohes kg/cm2 at lime 4% and it increases according to lime content. The percentage of lime increased, CBR value is also increased. limestone. Lime is most commonly used as a modifier of cohesive soils. The quantity of lime used stabilization of most soils usually is in the range of 2% - 10%. The main benefit from lime stabilzation is the reduction of the soil's plasticity, and the soil becomes more rigid. It also increases the strength and workability of the soil, and reduces swell. Soil lime stabilization is more suitable in warm region than in cold region. Soil base course for low traffic roads. It cannot be used as surface course as it has little resistance to abrasion and impact. II. TESTING OF SOIL METHODS The following tests are performed to determine the engineering properties of cohesive soils. 1.Water Content Determination 2.Specific Gravity Test 3.Grain-size Analysis Test 4.Atterberg Limits Test 5.Free Swell Test 6.Standard Proctor Compactio 7.Triaxial Shear Test 8.California Bearing Ratio (CBR) Test A.Water Content Determination Water content is defined as the ratio of the weight of water to the weight of solids in the soil. Table 1 shows the specific gravity for various types of soil. w w − 2 Where, ω = water content (%) W1 = Weight of container plus wet soil W1 = Weight of container plus wet soil Soil is a unique natural material and the properties of soils can be altered by adding stabilizing agents such he oldest traditional stabilizer used for soil stabilization. Lime is one of the several products that can be used in the improvement of the engineering characteristics of soils. This research presents the effect of lime on engineering properties ive soil. In order to identify and classify this soil, at first physical properties of soil are determined. And then, mechanical property tests are conducted. Next, lime is added to natural soils. Lime contents are selected as 4%, 6% and 8% by weight of natural soils. The plasticity index decrease with increasing the percentage of lime content. Soil is mixed with selected lime contents at their maximum dry density. In cohesive soil, the more the lime content, the more the cohesion. The lowest value of cohesion is 0.59 kg/cm2 at lime 4% and it increases according to lime content. The percentage of lime increased, CBR value limestone. Lime is most commonly used as a modifier of cohesive soils. The quantity of lime used for stabilization of most soils usually is in the range of 10%. The main benefit from lime stabilzation is the reduction of the soil's plasticity, and the soil becomes more rigid. It also increases the strength and workability of the soil, and reduces the soil's ability to swell. Soil lime stabilization is more suitable in warm region than in cold region. Soil-lime can be used as base course for low traffic roads. It cannot be used as surface course as it has little resistance to abrasion TESTING OF SOIL METHODS The following tests are performed to determine the engineering properties of cohesive soils. Water Content Determination KEYWORD: Cohesive Soil, Stabilization, Lime I. INTRODUCTION Cohesive soils are those possessing cohesion. They have a higher water content and a natural tenancy to "ball" together when squeezed. Under pressure from loads these type of soils settle and consolidate over a number of years. These soils contain sufficie quantities of clay to render soil mass virtually impermeable when properly compacted. Such soils are all verities of clay or clayey soils. Cohesive soil is available everywhere in Myanmar and this is not suitable for engineering Addition of lime to clayey soils to improve their engineering properties is a well-established practice. Lime used in stabilization is the product of calcining Lime used in stabilization is the product of calcining Cohesive Soil, Stabilization, Lime Standard Proctor Compaction Test California Bearing Ratio (CBR) Test Cohesive soils are those possessing cohesion. They have a higher water content and a natural tenancy to "ball" together when squeezed. Under pressure from loads these type of soils settle and consolidate over a number of years. These soils contain sufficient quantities of clay to render soil mass virtually impermeable when properly compacted. Such soils Water Content Determination Water content is defined as the ratio of the weight of water to the weight of solids in the soil. Table 1 shows the specific gravity for various types of soil. − ω = x 100% x 100% 1 2 Cohesive soil is w w available everywhere in Myanmar and this is not suitable for engineering tion of lime to clayey soils to improve their c construction construction works. works. established practice. @ IJTSRD | Available Online @ www.ijtsrd.com @ IJTSRD | Available Online @ www.ijtsrd.com | Volume – 2 | Issue – 5 | Jul-Aug 2018 Aug 2018 Page: 1757
International Journal of Trend in Scientific Research and Development (IJTSRD) ISSN: 2456-6470 W2 = Weight of container plus dry soil WC = Weight of container B.Specific Gravity Test Specific gravity is defined as the ratio of the unit weight of a given material to the unit weight of water. Table.1 displays the specific gravity for various types of soil. Gs = W s − Where, Gs = Specific gravity of soil K = Specific gravity of water at temperature (t) WS = Weight of air-dry soil W1 = Weight of bottle plus water plus soil W2 = Weight of bottle plus water Table1. Specific Gravity for Various Types Of Soil Type of soil Sand Silty sand Inorganic soil Soils with micas of iron Organic soil Variably but may be under 2 C.Grain Size Analysis Grain size analysis is the determination of the size range of particles present in a soil, expressed as a percentage of the total dry weight. Two methods are used to find the particle size distribution of soil. 1.Sieve Analysis is used for particle sizes larger than 0.075 mm in diameter, and 2.Hydrometer Analysis is used for particle sizes smaller than 0.075 mm in diameter D.Atterberg Limit Test The Atterberg limit tests provide measurements of the water content of clayey soils. Atterberg limit test includes; 1.Liquid Limit ( LL ) 2.Plastic Limit ( PL ) 3.Shrinkage Limit (SL ) Liquid Limit (LL) – Liquid limit is defined as the moisture content, in percent, at which the soil changes from a liquid state to a plastic state. Plastic Limit (PL) – Plastic limit is defined as the moisture content, in percent, at which the soil changes from a plastic stage to a semi-solid state. Shrinkage Limit (SL) – The moisture content, in percent, at which the volume of the soil mass ceases to change, is defined as the shrinkage limit. Plasticity index (PI) - Plasticity index is the difference between the liquid limit and plastic limit. PI = LL – PL E.Free swell Test Free swell test is performed to determine the increase volume of the soil. Table2. Shows soil classification based on free swell ratio. × K W + s W W 1 2 V FSR= w V s Where, FSR = Free swell ratio Vw = Sediment volume of soil in distilled water (cm3) Vs = Sediment volume of soil in kerosene (cm3) Table2. Soil Classification Based on Free Swell Ratio Free swell ratio ≤ 1.0 Non-swelling Mixture of swelling and non-swelling 1.5-2.0 Swelling 2.0-4.0 Swelling ˃ 4.0 Swelling F.Standard Proctor Compaction Test Use to obtain the maximum dry density of the soil sample and the optimum Compaction reduces in soil void ratio by expulsion of air from the voids or by expulsion of water from the voids. Gs 2.65-2.67 2.67-2.70 2.7-2.80 2.75-3.00 Degree of expansion Clay type Negligible 1.0-1.5 Low Moderate High Very High moisture content. γ + γd = ω W 1 γ=V Where, γd γ W = weight of the compacted soil V = volume of the compacted soil ω = water content of the compacted soils = dry unit weight of soil = moist unit weight of soil @ IJTSRD | Available Online @ www.ijtsrd.com | Volume – 2 | Issue – 5 | Jul-Aug 2018 Page: 1758
International Journal of Trend in Scientific Research and Development (IJTSRD) ISSN: 2456-6470 G.Triaxial Shear Test Triaxial shear test is one of the most reliable methods for determining the shear strength parameter. σ1= σ3 +∆σf Where, σ1 = major principal stress σ3 = minor principal stress (confined pressure) ∆σf = deviator stress at failure (piston stress) H.California Bearing Ratio (CBR) Test The determination of the potential strength of sub- grade, sub-base, and base course material, including recycle materials for use in road and airfield pavement. Classification system on the basic of CBR number is shown in Table.3. P Table5. Result of Specific Gravity Bottle no. Wt. of bottle + water + soil, W1 (gm) Temperature, t ( Wt. of bottle + water, W2 (gm) Wt. of dish + dry soil Wt. of dish Wt. of dry soil, Ws Specific gravity of water at t, Gt Specific gravity, Gs Mean specific gravity, Gs 1 1 1 685.3 684.9 684.8 oC) o o o 40 42 44 626.3 626.1 625.6 374.1 281.1 93 374.1 281.1 93 374.1 281.1 93 0.9922 0.9915 0.9907 2.71 2.70 2.71 2.73 T CBR = × 100 P s Where, PT Ps Table3. Classification System on the Basic of CBR number CBR number General rating 0-3 Very poor 3-7 Poor to fair 7-20 fair 20-50 good ˃50 Very good III.TEST RESULTS OF STUDIED SOIL The results of cohesion soil are as follows. Table4. Result of Water Content Determination Determination no. Container no. Wt. of container + wet soil, W1 (gm) Wt. of container + dry soil, W2 (gm) Wt. of container, Wc (gm) Wt. of water, W1 - W2 (gm) Wt. of dry soil, W2 - Wc (gm) 10.70 12.10 Water content,ω (%) Mean water content, ω (%) = total test load = standard test load Fig1. Particle Size Distribution Curve Uses Sub-grade Grade Sub-base Sub-base, base Base Fig2. Flow Curve for Liquid Limit Determination of Cohesive Soil Table.6 Results of Atterberg Limit Test LL PL 1 33 2 43 3 60 PI SL 23.30 26.30 22.50 74.3 28.81 45.49 6.71 18.90 21.30 18.40 8.20 4.40 9.20 5.00 8.50 4.10 9.90 Table.7 Results of Free Swell Test V Vw Vk FSR =V w Soil 41.12 41.32 41.41 k 41.28 Cohesive 22 12 1.83 @ IJTSRD | Available Online @ www.ijtsrd.com | Volume – 2 | Issue – 5 | Jul-Aug 2018 Page: 1759
International Journal of Trend in Scientific Research and Development (IJTSRD) ISSN: 2456-6470 Table9. Physical and Mechanical Properties of Studied Soil Sr No. Property Grain size distribution (a) Gravel (%) (b) Sand (%) (c) (d) 2 Specific gravity Consistency limits Liquid limit (%) Plastic limit (%) Plasticity index (%) Shrinkage limit (%) Free swell Free swell ratio Standard proctor compaction test OMC (%) Max dry density (lb/ft3) Triaxial Test c (kg/cm2) φ (degree) 7 CBR value (%) Values - 5.5 62 32.5 2.71 74.3 28.81 45.49 6.71 1.83 20.8 90.5 0.89 10° 15 1 Clay (%) Silt (%) 3 Fig 3. Compaction Curve for Cohesive Soil 4 5 6 IV.EXPERIMENTAL INVESTIGATION ON EFFECT OF LIME The consistency limits, compaction characteristics, triaxial test and CBR values of the lime treated cohesive soil are determined. 4%, 6% and 8% of lime is considered for investigation. A.Consistency Limit Fig. 5 shows the variation of consistency limits with lime content. It decreases the liquid limit and increases the plastic limit of cohesive soil resulting in a decrease in plasticity index. The plasticity index decreases from about 45% to 8% for lime contents varying from 0 to 8%. The consistency limits with various lime percent are shown in Table.10. Table.10 Consistency Limits 0% Lime Lime LL 74.3 68.18 PL 28.81 39.42 PI 45.49 28.76 Normal Stress(kg/cm2) Fig 4. Result for Triaxial Curve Table 8. Results of CBR Test for Cohesive Soil at OMC Dial gauge reading To p 0.025 24 0.050 34 0.075 42 Load (psi) Standa rd load (psi) CB R (%) Penetrat ion (in) Botto m 14 16 22 To p 19 6 24 0 Botto m 0.100 1000 49 26 104 15 0.150 56 30 12.5 4 0.200 1500 60 34 136 4% 6% Lime 59.4 42.73 16.67 8% Lime 52.08 44 8.08 Type 0.300 0.400 0.500 65 68 71 39 43 46 Engineering properties of natural soils are Summarized in Table9. @ IJTSRD | Available Online @ www.ijtsrd.com | Volume – 2 | Issue – 5 | Jul-Aug 2018 Page: 1760
International Journal of Trend in Scientific Research and Development (IJTSRD) ISSN: 2456-6470 C.Triaxial Test Table.12 shows the value of cohesion and angle of internal friction of cohesive soil with and without lime. The percentage of lime from 4 to 6%, the value of cohesion is decreased. It is increased nearly about the value of natural soil at 8% of lime content. The maximum value of angle of internal friction, φ is found at 4% of lime, after that its value decrease with increasing percent dosage of lime. Table.12 Results of Triaxial Test Comparison 0% Lime 0.89 4% Lime 0.59 6% Lime 0.62 8% Lime 0.83 0% Lime 10° 4% Lime 21° 6% Lime 20° 8% Lime 13° D.California Bearing Ratio (C. B. R.) Fig. 8 shows the variation of CBR values with and without lime. CBR test results comparisons are also shown in Table.13. The CBR samples are treated with 4, 6 and 8% of lime are tested under unsoaked condition. The value of CBR increase, the lime content increase. According to Table.3, CBR samples are treated with 4% of lime, the general rating is changed fair to good condition. At 8% of lime, the general rating is very good. Table.13 CBR Test Results Comparison Samples CBR value General rating 0% Lime 15.00 4% Lime 37.60 6% Lime 44.00 8% Lime 58.80 80 0% 60 40 4% 20 6% 0 8% LL (%) PL (%) PI (%) SL (%) Fig5. Consistency Limits B.Compaction Characteristics Fig. 6 and 7 show the comparison of compaction characteristic untreated and lime treated cohesive soil. It can be observed that, the maximum dry density is increases when the lime is added. But the increase in percentage of lime, maximum dry density goes on decreasing. The more the percent dosage of lime, the higher the OMC, the maximum OMC is found at 6% of lime, and at 8%, the OMC is decreased. Table.11 Results of Compaction Test Comparison 0% Lime Optimum moisture content (%) Maximum dry density(lb/ft3) c(kg/cm2) φ(degree) 4% Lime 6% Lime 8% Lime Type 23 20.8 22.2 24.5 90.5 93.6 93.2 92.5 25 Optimum oisture content 24.5 24 23 23 22.5 (%) 22 21 20.8 Fair Good Good Very Good 20 0 2 4 6 Lime content (%) Fig6. Variation in Optimum Moisture Content Treated with Lime 70 60 94 Maximum dry dnsity 50 93.693.2 93 40 92.5 92 30 (lb/ft3) CBR 20 91 90.5 10 90 0 0 2 4 6 0% Lime 4% Lime 6% Lime 8% Lime Lime (%) Fig8. CBR values Fig7. Variation in Maximum Dry Density Treated with Lime @ IJTSRD | Available Online @ www.ijtsrd.com | Volume – 2 | Issue – 5 | Jul-Aug 2018 Page: 1761
International Journal of Trend in Scientific Research and Development (IJTSRD) ISSN: 2456 International Journal of Trend in Scientific Research and Development (IJTSRD) ISSN: 2456 International Journal of Trend in Scientific Research and Development (IJTSRD) ISSN: 2456-6470 V. This research deals with the effect of lime on engineering properties of cohesive soil. In this study, to identify and classify the studied soil, physical property tests are firstly carried out. Soil sample is taken from the depth of 3ft. It is used for th content determination, specific gravity, grain size analysis, Atterberg limits; free swell test, compaction characteristics, triaxial and CBR test. According to the test results, the natural soil can be concluded that; it has 62% of clay, 32.5% of silt, 5.5% of sand and 0% of gravel. And then, the studied soil has specific gravity of 2.71, free swell ratio of 1.83, liquid limit of 74.3%, plastic limit of 28.81%, plasticity index of 45.49%, Shrinkage limit of 6.71%, cohesion of 0.89 kg/cm2, angle of internal friction of 10 15. According to Table.1 and 2, the studied soil is inorganic soil and the degree of expansion is moderate. The general rating of studied soil is fair such as shown in Table.3. To know the effect of lime on engineering properties consistency limit, compaction characteristics, triaxial and CBR test are performed. Lime contents are selected as 4%, 6% and 8% of lime by weight of natural soil. From the result of consistency limit, it CONCLUSIONS This research deals with the effect of lime on engineering properties of cohesive soil. In this study, to identify and classify the studied soil, physical property tests are firstly carried out. Soil sample is taken from the depth of 3ft. It is used for the water content determination, specific gravity, grain size free swell test, compaction characteristics, triaxial and CBR test. According to the test results, the natural soil can be concluded that; ed that decrease in liquid limit and plasticity index with an increase of lime contents. When the lime contents are increased, the optimum moisture content and maximum dry density is slightly increased. From the triaxial test results, the more f lime, the cohesion is increased but the angle of internal friction is decreased. Not only the CBR value but also the general rating is increased when the dosage of lime increased. can be observed that decrease in liquid limit and plasticity index with an increase of lime contents. When the lime contents are increased, the optimum moisture content and maximum dry density is slightly increased. From the triaxial test results, the more percentage of lime, the cohesion is increased but the angle of internal friction is decreased. Not only the CBR value but also the general rating is increased when the dosage of lime increased. REFERENCES 1.[78 Jos] Joseph E. Bowels. Properties of Soils and Second Edition.USA. MC Graw 2.[05 Thu] Thu Zar Win. Ma. Properties of Clay treated with Lime Department of Civil Engineering MTU (2005) 3.Braja M. Das,: Advanced Soil Mechanics, Edition. (2008) 4.Braja M. Das,: Principal of Geotechnical Engineering, Seventh Edition. California State University, Sacramento, Company (2010). silt, 5.5% of sand and 0% of gravel. And then, the studied soil has specific gravity of 2.71, free swell ratio of 1.83, liquid limit of 74.3%, plastic limit of 28.81%, plasticity index of Shrinkage limit of 6.71%, cohesion of 0.89 [78 Jos] Joseph E. Bowels. Engineering Properties of Soils and Their Measurement. Second Edition.USA. MC Graw-Hill, Inc(1978) [05 Thu] Thu Zar Win. Ma. Study on Engineering Properties of Clay treated with Lime. ME Thesis. Department of Civil Engineering MTU (2005) 10° and CBR of 15. According to Table.1 and 2, the studied soil is inorganic soil and the degree of expansion is moderate. The general rating of studied soil is fair To know the effect of lime gineering properties consistency limit, compaction characteristics, triaxial and CBR test are performed. Lime contents are selected as 4%, 6% and 8% of lime by weight of natural soil. From the result of consistency limit, it Advanced Soil Mechanics, Third of of cohesive cohesive soil, soil, Principal of Geotechnical Seventh Edition. California State Sacramento, University, PWS PWS Publishing Publishing @ IJTSRD | Available Online @ www.ijtsrd.com Available Online @ www.ijtsrd.com | Volume – 2 | Issue – 5 | Jul-Aug 2018 Aug 2018 Page: 1762