Download
1 / 8
80 likes | 87 Views
The present research presents the results obtained from a practical study with respect to the evaluation of the quality of a forecast for an industrial product using the regression analysis. A 95 reliability and a 5 error were used for the validation of the partial samples of the conductivity and density of the product. For the regression analysis the specialized software Minitabu00ae was used in its test version. The results obtained in the research were that the regression model and the parameters of the model are significant, reason why, the regression analysis is significant. Gonzu00c3u00a1lez Torres Arturo | Rodru00c3u00adguez Cuellar Ruth | Marru00c3u00b3n Ramos Domingo Nou00e9: | Robles Ramu00c3u00adrez Diana P. Y | Sevilla Pu00e9:rez Rafael "Evaluation of the Quality of a Prognosis for an Industrial Product using the Regression Analysis" Published in International Journal of Trend in Scientific Research and Development (ijtsrd), ISSN: 2456-6470, Special Issue | 2nd International Congress of Engineering , October 2017, URL: https://www.ijtsrd.com/papers/ijtsrd5822.pdf Paper URL: https://www.ijtsrd.com/engineering/other/5822/evaluation-of-the-quality-of-a-prognosis-for-an-industrial-product-using-the-regression-analysis/gonzu00e1lez-torres-arturo<br>

E N D
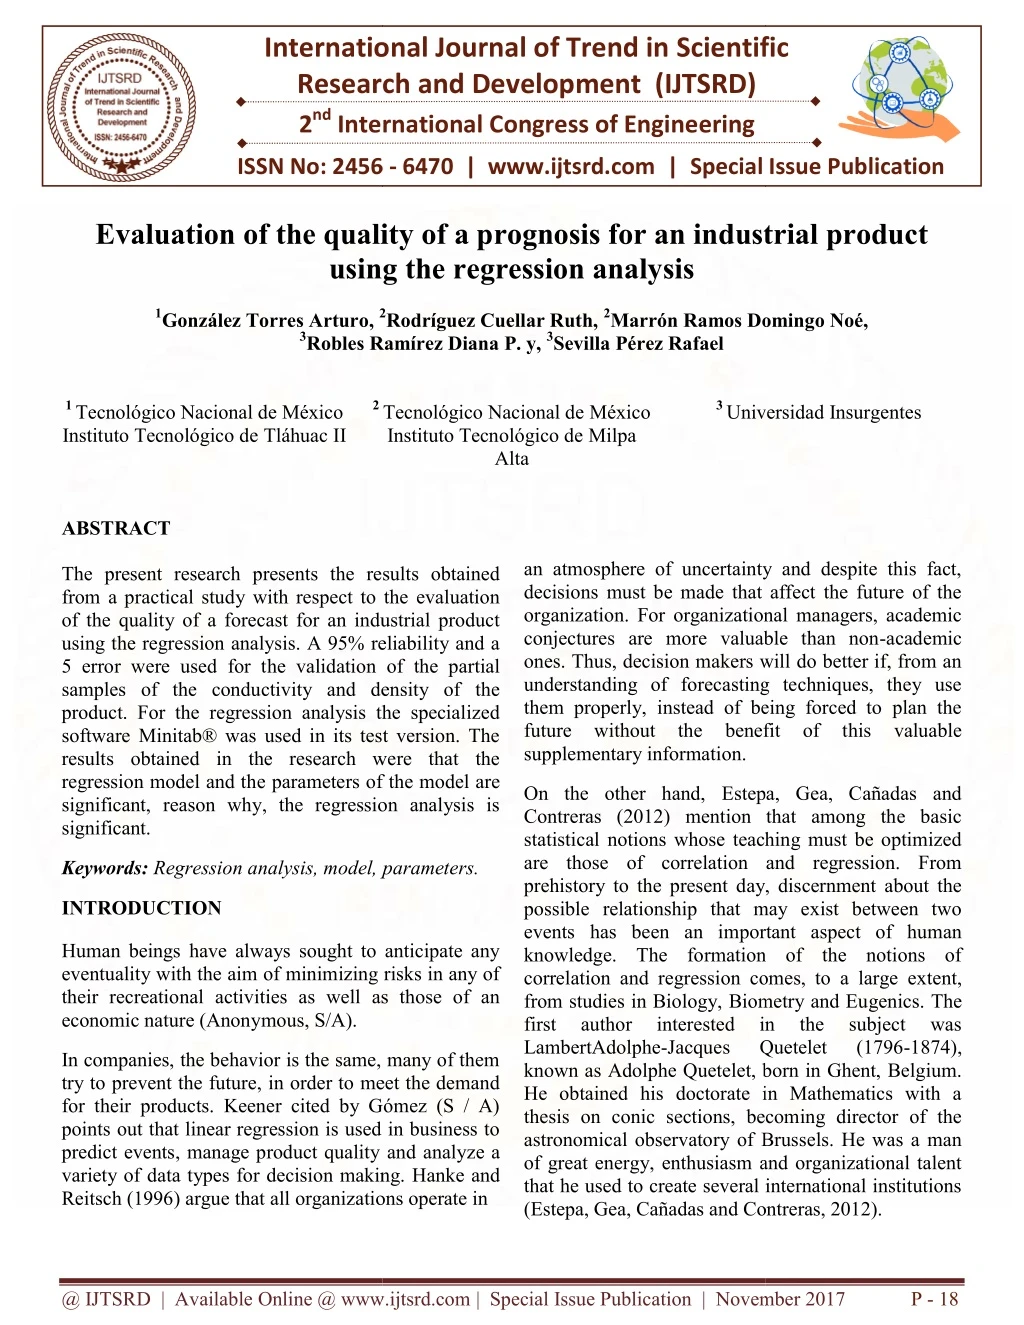
International Research 2nd International Congress of Engineering International Congress of Engineering valuation of the quality of a prognosis for an industrial product using the regression analysis International Journal of Trend in Scientific Research and Development (IJTSRD) Scientific ISSN No: 2456 ISSN No: 2456 - 6470 | www.ijtsrd.com | Special Issue Special Issue Publication Evaluation of the quality of a p rognosis for an industrial product using the regression analysis 1González Torres Arturo, 2 2Rodríguez Cuellar Ruth, 2Marrón Ramos Domingo Noé, Marrón Ramos Domingo Noé, 3Robles Ramírez Diana P. y, Robles Ramírez Diana P. y, 3Sevilla Pérez Rafael Tecnológico Nacional de México Instituto Tecnológico de Milpa Alta 1 Tecnológico Nacional de México Instituto Tecnológico de Tláhuac II ABSTRACT The present research presents the results obtained from a practical study with respect to the evaluation of the quality of a forecast for an industrial product using the regression analysis. A 95% reliability and a 5 error were used for the validation of the partial samples of the conductivity and density of the product. For the regression analysis the specialized software Minitab® was used in its test version. The results obtained in the research were that the regression model and the parameters of the model are significant, reason why, the regression analysis is significant. 2 3 Unive Universidad Insurgentes an atmosphere of uncertainty and despite this fact, decisions must be made that affect the future of the organization. For organizational managers, academic conjectures are more valuable than non-academic ones. Thus, decision makers will do better if, from an understanding of forecasting techniques, they use them properly, instead of being forced to plan the future without the benefit of this valuable an atmosphere of uncertainty and despite this fact, decisions must be made that affect the future of the organization. For organizationa conjectures are more valuable than non ones. Thus, decision makers will do better if, from an understanding of forecasting techniques, they use them properly, instead of being forced to plan the future without the benefit of t supplementary information. The present research presents the results obtained from a practical study with respect to the evaluation of the quality of a forecast for an industrial product using the regression analysis. A 95% reliability and a he validation of the partial samples of the conductivity and density of the product. For the regression analysis the specialized software Minitab® was used in its test version. The results obtained in the research were that the ameters of the model are On the other hand, Estepa, Gea, Cañadas and Contreras (2012) mention that among the basic statistical notions whose teaching must be optimized are those of correlation and regression. From prehistory to the present day, discernment about the possible relationship that may exist between two events has been an important aspect of human knowledge. The formation of the notions of correlation and regression comes, to a large extent, from studies in Biology, Biometry and Eu first author interested LambertAdolphe-Jacques known as Adolphe Quetelet, born in Ghent, Belgium. He obtained his doctorate in Mathematics with a thesis on conic sections, becoming director of the astronomical observatory of Brussels. He was a man of great energy, enthusiasm and organizational talent that he used to create several international institutions (Estepa, Gea, Cañadas and Contreras, 2012). (Estepa, Gea, Cañadas and Contreras, 2012). On the other hand, Estepa, Gea, Cañadas and Contreras (2012) mention that among the basic statistical notions whose teaching must be optimized are those of correlation and regression. From significant, reason why, the regression analysis is Keywords: Regression analysis, model, parameters. Regression analysis, model, parameters. ay, discernment about the INTRODUCTION possible relationship that may exist between two events has been an important aspect of human knowledge. The formation of the notions of correlation and regression comes, to a large extent, from studies in Biology, Biometry and Eugenics. The first author interested Jacques known as Adolphe Quetelet, born in Ghent, Belgium. He obtained his doctorate in Mathematics with a thesis on conic sections, becoming director of the omical observatory of Brussels. He was a man of great energy, enthusiasm and organizational talent that he used to create several international institutions Human beings have always sought to anticipate any eventuality with the aim of minimizing risks in any of their recreational activities as well as those of an economic nature (Anonymous, S/A). Human beings have always sought to anticipate any eventuality with the aim of minimizing risks in any of nal activities as well as those of an in in Quetelet Quetelet the the subject subject (1796 (1796-1874), was was In companies, the behavior is the same, many of them try to prevent the future, in order to meet the demand for their products. Keener cited by Gómez (S / A) points out that linear regression is used in business to predict events, manage product quality an variety of data types for decision making. Reitsch (1996) argue that all organizations operate in ) argue that all organizations operate in In companies, the behavior is the same, many of them try to prevent the future, in order to meet the demand for their products. Keener cited by Gómez (S / A) points out that linear regression is used in business to predict events, manage product quality and analyze a data types for decision making. Hanke and @ IJTSRD | Available Online @ www.ijtsrd.com @ IJTSRD | Available Online @ www.ijtsrd.com | Special Issue Publication | November November 2017 P - 18
International Journal of Trend in Scientific Research and Development (IJTSRD) ISSN: 2456-6470 Special Issue of 2nd International Congress of Engineering Within companies, they seek to have their all their processes under control, the essential characteristics of a process are: variability: never two results are exactly the same and repeatability: the more repetitions the more experience (García, 2016). In the modern business world Pelayo (S / A) says that the concept of management has been installed, although this term may be broad or unclear we will refer to management as defined by ISO 9000-2000 in point 3.2 .6 where management is defined as "Coordinated Activities to direct and control an organization". This concept of management is also the one that uses the National Quality Award (1999) in its bases. It was he who first used the term correlation in a study presented in 1846 at the Academy of Sciences in France. However, Pearson (1965) will indicate that Bravais, when studying the theory of errors, did not consider correlated random variables, but considered errors independent of each other; therefore, did not arrive at a true idea of the correlation, as we know it today. Devore, (2005) notes that the term regression was first used as a statistical concept in 1877 by Sir Francis Galton, who conducted a study that showed that the height of children born to high parents tended to regress or "regress "Towards the average height of the population. He designated the word regression as the name of the general process of predicting a variable (the height of the children) from another (the stature of the father or the mother). Later, statisticians coined the term multiple regression to describe the process by which several variables are used to predict another. Companies today use regression analysis to forecast future data, but many of them are SMEs unaware that there are mathematical models that help predict this data. Varela and Reyes (2009) point out that the purpose of forecasts is to predict the future development of different projects, to assist in decision making on projection measures such as the level of investment, production, and other measures that influence, lesser degree, on the tendency of the object raised, in our case the measures and actions that could be taken is in the level of preferences of the population with respect to the sector of white line. Morales and Parra (2016) point out that, in an environment of uncertainty, where decision making is increasingly complex, the preparation of forecasts is a very useful tool for managers, since they are necessary to establish the general course of the organization both over a long period through long- term forecasts and in a short period designing immediate strategies to meet future needs through short-term forecasts. Quality today is fundamental for the assurance of conforming products, with statistical control of quality being fundamental (Díaz, Bautista and Ortiz, 2013). For this reason, it is established the need to engage simple linear regression analysis in the forecast of a production process, in order to know if the company knows well the subject of forecast and, in turn, to know if it uses well the techniques of linear regression. It has been detected that the employees of the company under study make their forecasts in an archaic way and are unaware of the aforementioned issues. Reyes (2009) mentions that prior to the 1950s the efforts developed at the time were limited to analysts, despite handling some theories of linear regression and decomposition of time series, lack of appropriate data and tedious calculations required to obtain a forecast. A forecast is information with a certain degree of probability of what might happen. The probability of success is a direct function of the preparation of the forecasts. In other words, the result of the planning and operation of the company is directly linked to the certainty of the forecasts (Grijalva, 2009). Everett and Ronald (1991) mention that a forecast is a process of estimating a future event, projecting data from the past into the future. Past data is systematically combined by default to estimate the future. Zurita (2010) argues that forecasts support decision-making in different areas of business management: sales forecasting will help design the production plan, forecast commodity price developments, supplies, etc. Zeissig (2010) argues that forecasts can be estimated REGRESSION ANALYSIS The oldest discipline seems to have made a special pact, to contribute (almost all), each from its point of view, to the "gestation, birth and upbringing" of units, which later would be associated to constitute that conceptual body called Statistics and Soto, 1988). Seal (1967) points out that Augusto Bravais contributed to the development of this theory from another field: astronomy, when studying the errors in the measurements of the coordinates of space bodies. @ IJTSRD | Available Online @ www.ijtsrd.com | Special Issue Publication | November 2017 P - 19
International Journal of Trend in Scientific Research and Development (IJTSRD) ISSN: 2456-6470 Special Issue of 2nd International Congress of Engineering by two criteria: the quantitative and the qualitative. The former analyzes mathematical models and statistics, and the second using knowledge of the current market situation and its environment. The best production forecast will be the one with the best information mix of both criteria. Chapman (2006) defines the formulation of forecasts of the technique to use past experiences in order to predict expectations of the future. Following the ideas of the same authors, they mention that in this model, y is a linear function of x (the part α + βx) plus ε (Greek letter epsilon) representing the error y is a random variable. Anderson, Sweeney and Williams (2001) point out that the error term explains the variability in y that cannot be explained by the linear relationship. historical data using The method of least squares has a long history that goes back to the beginning of the nineteenth century. In June 1801, Zach, an astronomer Gauss had known two years earlier, published the orbital positions of the celestial body Ceres, a new "small planet" discovered by the Italian astronomer G. Piazzi in the same year. Unfortunately, Piazzi had only been able to observe 9 degrees of its orbit before this body disappeared after the sun. Zach published several predictions of his position including one of Gauss that differed remarkably from the others. When Ceres was rediscovered by Zach in December 1801 it was almost exactly where Gauss had predicted (Cruces, S / A). The method of ordinary least squares consists of obtaining a hyperplane so that the sum of the squares of the distances between each of the observations of the variable and said (Chirivella, S/A). Montgomery, D., Peck, E. and Vining (2006) mention that linear regression models are widely used in engineering since they serve to analyze the behavior of input (or regressor) and output (or response) variables predictions and estimates. On the other hand, Badii, Guillen, Cerna, Valenzuela and Landeros (2012) indicate that regression and correlation are two closely related techniques and comprise a form of estimation. More specifically, regression analysis include the study of sampling data to know what two or more variables are related to one another in a population. Correlation analysis produces a number that summarizes the degree of correlation between two variables; and regression analysis gives rise to a mathematical equation that explains and predicts this relationship. correlation and hyperplane (residues) Lopez and Romero (2014) mention that the simple or bivariate RL models are used as models of prediction or prognosis. The most typical case is when the predictor, regressor or independent variable X is a controlled variable (non-random), while the response variable or dependent variable Y is a random variable that has an approximately normal distribution for each x value of X, but with constant variance Escalante (2013) mentions that regression analysis is a technique used to relate, through a model, one or more independent variables to a dependent variable (response). GENERAL OBJECTIVE Assess the quality of a prognosis for an industrial product using the regression analysis. Specific objectives Understand the contextualization of the topic. . 2 Know the existing models to evaluate the quality of an industrial process. Calculate the representative sample using 95% confidence. Apply the regression analysis on the representative samples. Orellana (2008) mentions that the simplest function for the relationship between two variables is the linear function: Analyze the results obtained from the regression analysis on the representative samples. Y = a + b X Evaluate the results obtained from the regression analysis on the representative samples. Cardona, González, Rivera and Cárdenas (2013) mention that the general equation describing the relationship between the two variables is: y = α + βx + ϵ @ IJTSRD | Available Online @ www.ijtsrd.com | Special Issue Publication | November 2017 P - 20
International Journal of Trend in Scientific Research and Development (IJTSRD) ISSN: 2456-6470 Special Issue of 2nd International Congress of Engineering 3.Validation of preliminary samples. At this stage it was validated if six preliminary samples were more than sufficient for the study. Both the conductivity and density samples were validated, the formula used was as follows: n METHODOLOGY The study had seven stages, Figure 1 shows an example of the phases. 2 Z * e 1. Conceptualización del tema 2 2. Toma de muestras preliminares Where: n: number of samples needed for the study. Z: value corresponding to the gauss distribution, for the investigation Z = 95%, which is equal to 1.96. : standard deviation of the preliminary sample. i: error expected to be committed in the study. The error is set to integer. 3. Válidación de las muestras preliminares. 4. Cálculo del análisis de regresión. 5. Análisis de resultados. 6. Conclusiones. Very important, if the result of the formula is smaller than the size of the preliminary sample, the study is considered good or sufficient. Otherwise, if the number of the formula is greater than the size of the preliminary sample, the study is not suffering, which means that samples are missing to perform for the study to be complete. The development of the formula for conductivity is as follows: 7. Recomendaciones. Figure 1. Example of methodological steps 1.Conceptualization of the theme. At this stage a bibliographic review of the topic was carried out. 2.Preliminary sampling. In this phase the problem proposed by Dr. Grunenfelder (2017) was taken into account, where 6 important samples of the process were taken in the identification of a suitable substitute for biodegradable materials in the fast food packaging industry. Six samples of the conductivity and 6 samples of the density were taken. 2 2 . 1 96 0043 . 0 * 0084 . 0 2 n . 0 ( 0016 ) . 0 000002 1 5 5 The study noted that using 95% reliability, a permissible error 5 and a standard deviation of 0.0043, will require 0.000002 samples, if this number is rounded to the largest integer, it would be a sample. Which means that with a preliminary sample is more than enough, the preliminary study was performed six samples, which means that these six preliminary samples are sufficient. For the case of density, the result of the formula was 0.00017. In the same way, it is rounded to the largest integer, giving a result of 1 sample. Preliminary study was performed six samples, which means that those with the six samples is sufficient for the study. Table 1. Example of the samples taken for the preliminary study. Conductivity Density 0.175 0.048 0.22 0.0525 0.225 0.054 0.226 0.0535 0.25 0.057 0.2765 0.061 @ IJTSRD | Available Online @ www.ijtsrd.com | Special Issue Publication | November 2017 P - 21
International Journal of Trend in Scientific Research and Development (IJTSRD) ISSN: 2456 Special Issue of Special Issue of 2nd International Congress of Engineering International Journal of Trend in Scientific Research and Development (IJTSRD) ISSN: 2456 International Journal of Trend in Scientific Research and Development (IJTSRD) ISSN: 2456-6470 4.Calculation of regression analysis. version. Data were entered: condu shows an example of the above. Calculation of regression analysis. In this phase the specialized software Minitab® was used in its test version. Data were entered: conductivity (predictor variable) and density (response variable). Figure 2 ctivity (predictor variable) and density (response variable). Figure 2 In this phase the specialized software Minitab® was used in its test cialized software. Figure 2. Example of data entry to Minitab® spe Figure 2. Example of data entry to Minitab® specialized software. As can be seen, the previous figure shows how the data of both the conductivity variable and the density variable were As can be seen, the previous figure shows how the data of both the conductivity variable and the density variable were entered. Figure 3 shows an example of how the Minitab® specialized software in its test version, the predictor variab entered. Figure 3 shows an example of how the Minitab® specialized software in its test version, the predictor variable As can be seen, the previous figure shows how the data of both the conductivity variable and the density variable were entered. Figure 3 shows an example of how the Minitab® specialized software in its test version, the predictor variab (x) and the response variable (y) are chosen. (x) and the response variable (y) are chosen. Figure 3. Example of choosing variables in Minitab® specialized software. Figure 3. Example of choosing variables in Minitab® specialized software. An analysis that must be performed within the regression analysis is the meaning test, which determines in a statistical way if the regression model is worth obtaining (Escalante, 2013). For this and following the ideas of the same author, the hypotheses that are raised are the following: Ho: B1 = 0 (There is no linear relationship between x, y). Regression does not make sense. Ha: B1 ≠ 0 (x is valuable t variation of y). Figure 3. Example of choosing variables in Minitab® specialized software. 5.Analysis of results. At this stage we proceeded to examine the results obtained from specialized Minitab® software. Table 2 shows an example of the results obtained from Minitab® software. results obtained from Minitab® software. At this stage we proceeded to An analysis that must be performed within the regression analysis is the meaning test, which ermines in a statistical way if the regression model is worth obtaining (Escalante, 2013). For this and following the ideas of the same author, the hypotheses that are raised are the following: examine the results obtained from specialized Minitab® software. Table 2 shows an example of the Table 2. Sample result of the model Model Y = -0.188 + 7.67 x e 2. Sample result of the model Ho: B1 = 0 (There is no linear relationship gression does not make The above table indicates the linear regression model that will have the study process. With this equation it will be possible to predict future data of the density of the product. tes the linear regression model ≠ 0 (x is valuable to explain the that will have the study process. With this equation it will be possible to predict future data of the density of @ IJTSRD | Available Online @ www.ijtsrd.com @ IJTSRD | Available Online @ www.ijtsrd.com | Special Issue Publication | November November 2017 P - 22
International Journal of Trend in Scientific Research and Development (IJTSRD) ISSN: 2456-6470 Special Issue of 2nd International Congress of Engineering For this, the analysis of variance was used. In the same way, the specialized software Minitab® was used in its test version, Table 3 shows an example of the obtained results. Table 3. Example of variance analysis result. Análisis de Varianza GL Fuente 1 Regresión 4 Error residual 5 Total SC MC F P 0.0056371 0.0056371 275.84 0.000 0.0000817 0.0000817 0.0057189 Continuing with the analysis to be performed within the regression, the significance test for the model parameters was applied. For the parameter Y and x, the following hypothesis was used: Ho: B1 = 0 Ha: B1 ≠ 0 For this, the analysis of variance was used using the specialized software Minitab® in its test version, Table 4 shows an example of the obtained results. The above table shows the results obtained in the analysis of variance using Minitab® software. The important thing and following the ideas of Escalante (2013), is to put much emphasis in the column of F. If the F calculated in table 3 is greater to the F obtained from the book, it is said that Ho is rejected. According to Escalante's book (2013) and using a F0.05,1,4 = 7.71, comparing this result with that of the F of Table 3 that was 275.84, we conclude that Ho is rejected, which means that regression makes sense. Table 4. Example of result of analysis of variance for model parameters. Análisis de Varianza Predictor Coef. Coef. De EE 0.02516 0.4618 7.Design of proposals for action. From the analysis of the results and conclusions obtained, lines of action are proposed to improve the quality of the process. CONCLUSIONS The simple linear regression forecast is an optimal model for trend patterns (increasing or decreasing), that is, patterns that have a linear relationship between demand and time. (Salazar, 2016). The present research reached the general objective set. It was possible to evaluate the quality of the process of an industrial product using the regression analysis. It is inferred using 95% reliability and 5 errors in the research, that the regression model and its parameters make sense, in other words, they are reliable. T P -0.18796 7.6696 -7.47 16.61 0.002 0.000 Constante x The above table shows the results obtained in the analysis of variance for the model parameters using Minitab® software. The important thing and following the ideas of Escalante (2013), is to put much emphasis in the column of the P, that is equivalent to the P value. If the value p <α, Ho will be rejected. The P value of the parameters Y and x are as follows: Y is 0.002 and x is 0.000. Comparing the two results of the P values it is observed that the two are less than the value of α which is 0.05, therefore, in both parameters Ho is rejected, which means that the regression model is significant. 6. Conclusions After analyzing the data obtained from the partial samples, both general and specific conclusions were taken, in the conclusions section the above mentioned is explained. @ IJTSRD | Available Online @ www.ijtsrd.com | Special Issue Publication | November 2017 P - 23
International Journal of Trend in Scientific Research and Development (IJTSRD) ISSN: 2456-6470 Special Issue of 2nd International Congress of Engineering regresión y su uso en el aula. Revista NUMEROS. Revista didáctica de matemáticas. Volumen 81, noviembre de 2012, páginas 5-14. REFERENCES 1)Anderson, D. R., Sweeney, D. J. y Williams, T. A. (2001). Estadística economía (7a ed., Vol. II). México: Thomson. para administración y 12)Everett, A. and Ronald, E. (1991). Administración de la producción y operaciones. Conceptos, modelos y funcionamiento. Editorial Pearson Prentice Hall. México 2)Anónimo. (S/A). Una aplicación real del método de regresión lineal. Tesis Digitales. Biblioteca Digital. Universidad de Sonora. 13)García Sánchez, D. (2016). Control estadístico y modelos de regresión lineal. una forma práctica de control de puentes. Tesis doctoral. Departamento de Ingeniería Estructural y Mecánica Escuela Técnica Superior de Ingenieros de Caminos, Canales y Puertos Universidad de Cantabria. Santander. España. 3)Badii, M. H., Guillen, A., Cerna, E., Valenzuela., J. y Landeros, J. (2012). Análisis de Regresión Lineal Simple para International Journal of Good Conscience. 7(3) 67-81. ISSN 1870-557X. Predicción. Daena: 4)Cardona Madariaga, D. F., González Rodríguez, J. L., Rivera Lozano, M. y Cárdenas Vallejo, E. (2013). Inferencia estadística. regresión lineal simple. Investigación No. 147. Universidad del Rosario. Escuela de Administración. Editorial Universidad del Rosario. Bogotá D.C. 14)Gómez, M. (S/A). Aplicación del análisis de regresión en los negocios. Ehow en español. Módulo de de Documento 15)Grijalva Cuantitativos para los negocios. Yauri, Y. E. (2009). Métodos 16)Grunenfelder (2017). Regression. Problem 1. Practice Problems. CHE 405. University of Southern California (USC). Course Hero, Inc. 5)Chapman, S. (2006). Planificación y control de la producción. México: Pearson Educación. 17)Hanke, J. E. y Reitsch, A. G. Pronósticos en los Negocios. Editorial Prentice Hall, México. 6)Chirivella González, V. (S/A). Hipótesis en el modelo de regresión lineal por Mínimos Cuadrados Ordinarios. Departamento Estadística e Investigación Operativa Aplicadas y Calidad. Centro Facultad de Administración y Dirección de Empresas. Universitat Politecnica de Valencia. 18)López Miranda, C. A. y Romero Ramos, C. A. (2014). Propuesta de proyecto de estadística: un modelo de regresión lineal simple para pronosticar la concentración de CO2 del volcán Mauna Loa. Epistemus. ISSN: 2007-4530 7)Cruces Álvarez, S. A. (S/A). El Método de Mínimos Cuadrados. Universidad de Sevilla. 19)Mayorga A., J. H. y Soto B., O. F. (1988). El análisis de regresión perspectiva histórica. Revista Colombiana de Estadística. 8)Devore, J. L. (2005). Probabilidad y estadística para ingeniería y ciencias. (6a ed.). México: Thomson Learning. 20)Montgomery, D., Peck, E. y Vining, G. (2006). Introducción al análisis de regresión lineal. México, Ed. Limusa Wiley, 588 p., ISBN: 970-24- 0327-8. 9)Díaz Castillo, B., Bautista Varela, J. A. y Ortiz Hernández, R. M. (2013). Herramientas de control de calidad aplicadas en los procesos de fabricación en una empresa de calzado en la ciudad de León, Guanajuato. Un estudio de caso. XVII Congreso Internacional Administrativas. Universidad del Valle de Atemajac. 21)Morales Cadme, D. F. y Parra Flores, V. M. (2016). Caracterización y análisis de la demanda de productos de línea blanca en ecuador. Periodo 2015. Trabajo de Titulación previo a la obtención del Título de Ingeniero Comercial. Escuela de Administración de Empresas. Ciencias Económicas y Administrativas. Cuenca, Ecuador. en Ciencias Facultad de 10)Escalante Vázquez, E. J. (2013). Seis Sigma: Metodologías y técnicas. 2ª. Edición. México. Limusa. 22)Orellana, L. (2008). Análisis de regresión. Estadística. Departamento 11)Estepa Castro, A., Gea Serrano, M.M., Cañadas de la Fuente, G. R. y Contreras García, J. M. (2012). Algunas notas históricas sobre la correlación y de Matemáticas. @ IJTSRD | Available Online @ www.ijtsrd.com | Special Issue Publication | November 2017 P - 24
International Journal of Trend in Scientific Research and Development (IJTSRD) ISSN: 2456-6470 Special Issue of 2nd International Congress of Engineering 27)Seal, H. L. (1967). The historical development of the Gauss linear model. Biometrika. 54, 1-24. Facultad de Ciencias Exactas y Naturales. Universidad de Buenos Aires. 23)Pelayo, M. F. (S/A). Determinación del grado de calidad de una empresa a partir de los indicadores de gestión. Tesis de Maestría en Calidad Industrial. 28)Varela, V. y Reyes, P. (2009). Administración de Operaciones: Métodos de Pronósticos. 29)Zeissig Dávila, J. A. (2010). Modelo de pronóstico y planificación de la producción de la línea de alto movimiento de fábrica de recubrimientos superficiales. Ingeniería. Universidad de San Carlos Guatemala. Guatemala. 24)Pearson, K. (1965). Somes incidents in the early history of biometry and statistics 1890-1894, Biometrika. 52, 3-18. Facultad de 25)Reyes, P. (2009). Administración de operaciones - Métodos de Pronósticos. 30)Zurita Olea, C. A. (2010). Desarrollo de un modelo de planificación de la producción en la siderúrgica Gerdau Aza S.A. Departamento de Ingeniería Industrial. Facultad de Ciencias Físicas y Matemáticas. Universidad de Chile. Santiago de Chile. Chile. 26)Salazar López, B. (2016). ¿Cuándo utilizar un pronóstico de regresión lineal? Regresión lineal o mínimos cuadrados. Ingeniería Industrial Online. @ IJTSRD | Available Online @ www.ijtsrd.com | Special Issue Publication | November 2017 P - 25