Download
1 / 24
250 likes | 357 Views
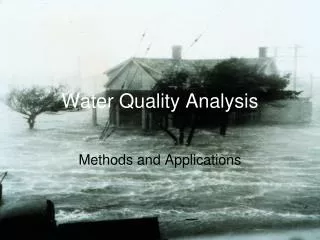
Applications of Regression to Water Quality Analysis. Unite 5: Module 18, Lecture 1. Statistics. A branch of mathematics dealing with the collection, analysis, interpretation and presentation of masses of numerical data Descriptive Statistics (Lecture 1) Basic description of a variable

E N D
Applications of Regression to Water Quality Analysis Unite 5: Module 18, Lecture 1
Statistics • A branch of mathematics dealing with the collection, analysis,interpretation and presentation of masses of numerical data • Descriptive Statistics (Lecture 1) • Basic description of a variable • Hypothesis Testing (Lecture 2) • Asks the question – is X different from Y? • Predictions (Lecture 3) • What will happen if…
Objectives • Introduce the basic concepts and assumptions of regression analysis • Making predictions • Correlation vs. causal relationships • Applications of regression • Basic linear regression • Assumptions • Techniques • What if it is not linear: data transformations • Water quality applications of regression analyses • Survey of regression software
A statistical technique to define the relationship between a response variable and one or more predictor variables Here, fish length is a predictor variable (also called an “independent” variable. Fish weight is the response variable Regression defined
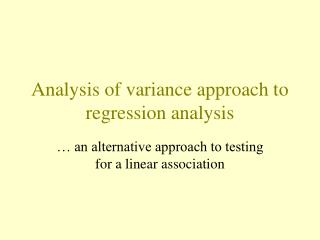
Regression and correlation • Regression: • Identify the relationship between a predictor and response variables • Correlation • Estimate the degree to which two variables vary together • Does not express one variable as a function of the other • No distinction between dependent and independent variables • Do not assume that one is the cause of the other • Do typically assume that the two variable are both effects of a common cause
Assumes there is a straight-line relationship between a predictor (or independent) variable X and a response (or dependent) variable Y Equation for a line:Y = mX + bm – the slope coefficient(increase in Y per unit increase in X) b – the constant or Y Intercept(value of Y when X=0) Basic linear regression
Assumes there is a straight-line relationship between a predictor (or independent) variable X and a response (or dependent) variable Y Regression analysis finds the ‘best fit’ line that describes the dependence of Y on X Basic linear regression
Assumes there is a straight-line relationship between a predictor (or independent) variable X and a response (or dependent) variable Y Outputs of regression Regression modelY = mX + bWeight = 4.48*Length + -28.722 Basic linear regression
Assumes there is a straight-line relationship between a predictor (or independent) variable X and a response (or dependent) variable Y Outputs of regression Regression modelY = mx + bWeight = 4.48*Length + -28.722 Coefficient of DeterminationR2 = 0.89 Basic linear regression
R2: The proportion of the total variation that is explained by the regression Coefficient of determination R2 = 0.89 Ranges from 0.00 to 1.00 0.00 – No correlation 1.00 – Perfect correlation no scatter around line How good is the fit? The Coefficient of Determination
R2 = 0.08 R2 = 0.54 Example coefficients of determination
Four assumptions of linear regression-adapted from Sokal and Rohlf (1981) • The independent variable X is measured without error • Under control of the investigator • X’s are ‘fixed’
Four assumptions of linear regression-adapted from Sokal and Rohlf (1981) • The independent variable X is measured without error • Under control of the investigator • X’s are ‘fixed’ • The expected value for Y for a given value of X is described by the linear function Y = mX +b
Four assumptions of linear regression-adapted from Sokal and Rohlf (1981) • The independent variable X is measured without error • Under control of the investigator • X’s are ‘fixed’ • The expected value for Y for a given value of X is described by the standard linear function y = mx +b • For any value of X, the Y’s are independently and normally distributed • Scan figure 14.4 from S&R
Four assumptions of linear regression -adapted from Sokal and Rohlf (1981) • The independent variable X is measured without error • Under control of the investigator • X’s are ‘fixed’ • The expected value for Y for a given value of X is described by the standard linear function y = mx +b • For any value of X, the Y’s are independently and normally distributed • Scan figure 14.4 from S&R • The variance around the regression line is constant; variability of Y does not depend on value of X • Extra credit word: the samples are homoscedastic
Data transformations: What if data are not linear? • It is often possible to ‘linearize’ data in order to use linear models • This is particularly true of exponential relationships
A classic use of regression: calibrate a lab instrument to predict some response variable – a “calibration curve” In this example, absorbance from a spectrophotometer is measured from series of standards with fixed N concentrations. Once the relationship between absorbance and concentration is established, measuring the absorbance of an unknown sample can be used to predict its N concentration N Applications: Standard curves for lab analyses
Using regression to estimate stream nutrient and bacteria concentrations in streams • The USGS has real time water quality monitors installed at several stream gaging sites in Kansas
Using regression to estimate stream nutrient and bacteria concentrations in streams: data flow
Using Regression to estimate stream nutrient and bacteria concentrations in streams: Results • USGS developed a series of single or multiple regression models • Total P = 0.000606*Turbidity + 0.186R2=0.964 • Total N = 0.0018*Turbidity + 0.0000940*Discharge + 1.08R2=0.916 • Total N = 0.000325 * Turbidity + 0.0214 * Temperature + 0.0000796*Conductance + 0.515R2=0.764 • Fecal Coliform = 3.14 * Turbidity + 24.2R2=0.62
Explanatory variables were only included if they had a significant physical basis for their inclusion Water temperature is correlated with season and therefore application of fertilizers Conductance is inversely related to TN and TP, which tend to be high during high flow Turbitidy is a measure of particulate matter – TN and TP are related to sediment loads The USGS needed a separate model for each stream! The basins were different enough that a general model could not be developed By using the models with the real-time sensors, USGS can predict events, e.g. when fecal coliform concentrations exceed criteria Using Regression to estimate stream nutrient and bacteria concentrations in streams: Important Considerations
Explanatory variables were only included if they had a significant physical basis for their inclusion Water temperature is correlated with season and therefore application of fertilizers Conductance is inversely related to TN and TP, which tend to be high during high flow Turbitidy is a measure of particulate matter – TN and TP are related to sediment loads The USGS needed a separate model for each stream! The basins were different enough that a general model could not be developed By using the models with the real-time sensors, USGS can predict events, e.g. when fecal coliform concentrations exceed criteria Concentration estimates can be coupled with flow data to estimate nutrient loads Finally, these regressions can be useful tools for estimating TMDL’s Using regression to estimate stream nutrient and bacteria concentrations in streams: Important Considerations
Software for regression analyses • Any basic statistical package will do regressions • SigmaStat • Systat • SAS • Excel and other spreadsheets also have regression functions • Excel requires the Analysis Toolpack Add-in • Tools > Add-in > Analysis ToolPack