Download
1 / 9
90 likes | 94 Views
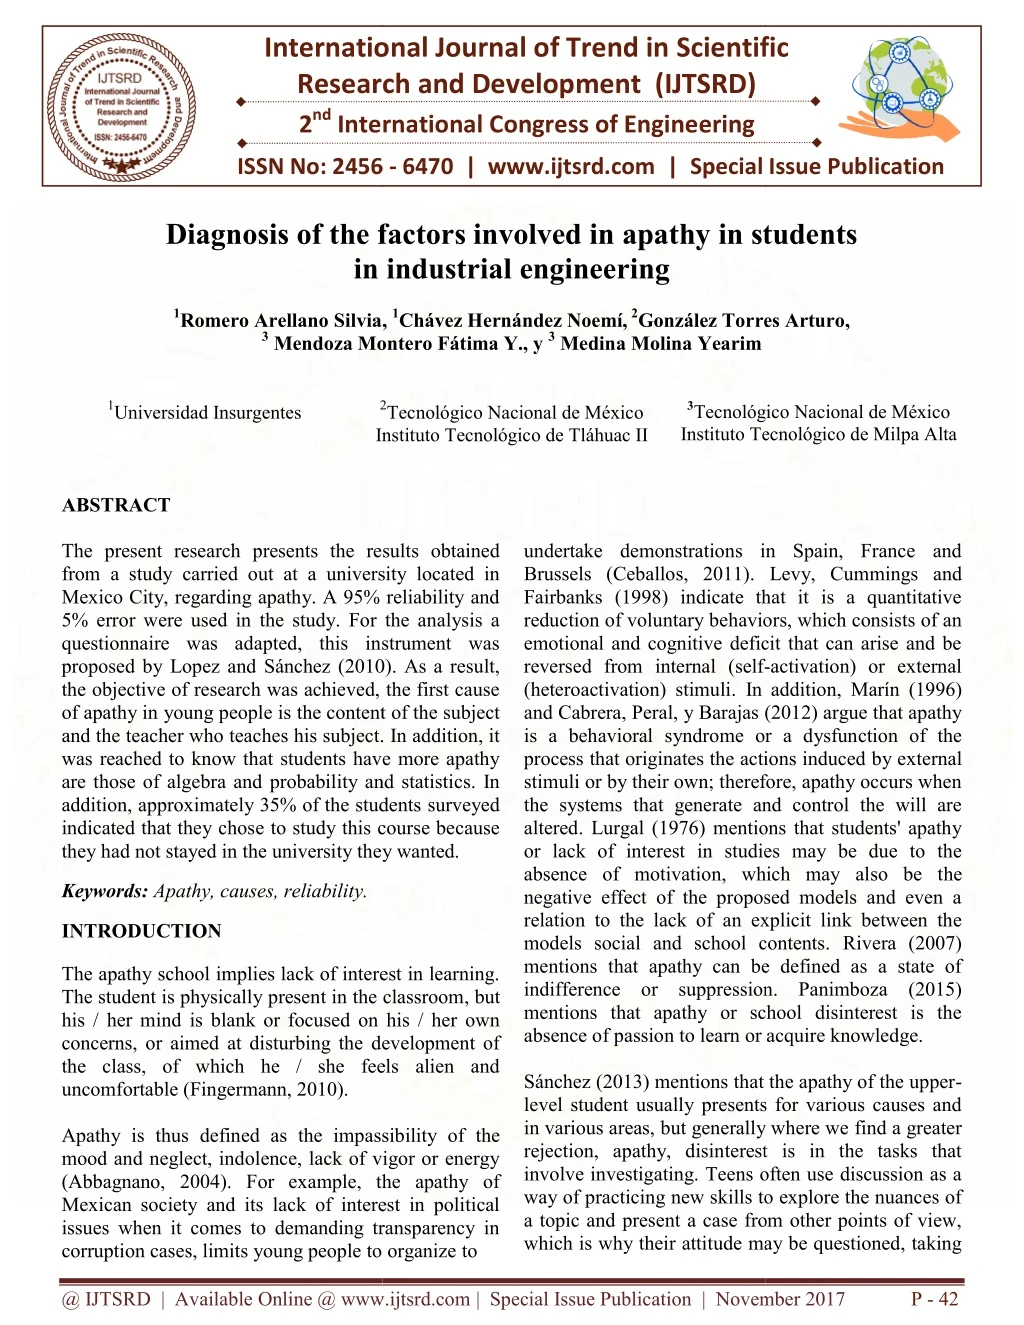
The present research presents the results obtained from a study carried out at a university located in Mexico City, regarding apathy. A 95 reliability and 5 error were used in the study. For the analysis a questionnaire was adapted, this instrument was proposed by Lopez and Su00c3u00a1nchez 2010 . As a result, the objective of research was achieved, the first cause of apathy in young people is the content of the subject and the teacher who teaches his subject. In addition, it was reached to know that students have more apathy are those of algebra and probability and statistics. In addition, approximately 35 of the students surveyed indicated that they chose to study this course because they had not stayed in the university they wanted. Romero Arellano Silvia | Chu00c3u00a1vez Hernu00c3u00a1ndez Noemu00c3u00ad | Gonzu00c3u00a1lez Torres Arturo | Mendoza Montero Fu00c3u00a1tima Y. Y | Medina Molina Yearim "Diagnosis of the Factors Involved in Apathy in Students in Industrial Engineering" Published in International Journal of Trend in Scientific Research and Development (ijtsrd), ISSN: 2456-6470, Special Issue | 2nd International Congress of Engineering , October 2017, URL: https://www.ijtsrd.com/papers/ijtsrd5825.pdf Paper URL: http://www.ijtsrd.com/engineering/other/5825/diagnosis-of-the-factors-involved-in-apathy-in-students-in-industrial-engineering/romero-arellano-silvia<br>

E N D
International Research 2nd International Congress of Engineering International Congress of Engineering iagnosis of the factors involved in apathy in students in industrial engineering International Journal of Trend in Scientific Research and Development (IJTSRD) Scientific ISSN No: 2456 ISSN No: 2456 - 6470 | www.ijtsrd.com | Special Issue Special Issue Publication Diagnosis of the factors involved in apathy in students in industrial engineering 1Romero Arellano Silvia, 3 Mendoza Montero Fátima Y., y Mendoza Montero Fátima Y., y 3 Medina Molina Yearim 2Tecnológico Nacional de México Instituto Tecnológico de Tláhuac II iagnosis of the factors involved in apathy in students , 1Chávez Hernández Noemí, 2González Torres Arturo González Torres Arturo, 1Universidad Insurgentes 2 3Tecnológico Nacional de México Instituto Tecnológico de Milpa Alta Instituto Tecnológico de Milpa Alta Tecnológico Nacional de México Instituto Tecnológico de ABSTRACT The present research presents the results obtained from a study carried out at a university located in Mexico City, regarding apathy. A 95% reliability and 5% error were used in the study. For the analysis a questionnaire was adapted, this instrument was proposed by Lopez and Sánchez (2010). As a result, the objective of research was achieved, the first cause of apathy in young people is the content of the subject and the teacher who teaches his subject. In addition, it was reached to know that students have more apathy are those of algebra and probability and statistics. In addition, approximately 35% of the students indicated that they chose to study this course because they had not stayed in the university they wanted. they had not stayed in the university they wanted. undertake demonstrations in Spain, France and Brussels (Ceballos, 2011). Fairbanks (1998) indicate that it is a quantitative reduction of voluntary behaviors, which consists of an emotional and cognitive deficit that can arise and be reversed from internal (self- (heteroactivation) stimuli. In addition, and Cabrera, Peral, y Barajas (2012) argue that apathy is a behavioral syndrome or a dysfunction of the process that originates the actions induced stimuli or by their own; therefore, apathy occurs when the systems that generate and control the will are altered. Lurgal (1976) mentions that students' apathy or lack of interest in studies may be due to the absence of motivation, which may al negative effect of the proposed models and even a relation to the lack of an explicit link between the models social and school contents. mentions that apathy can be defined as a state of indifference or suppression. Panimboza mentions that apathy or school disinterest is the absence of passion to learn or acquire knowledge. Sánchez (2013) mentions that the apathy of the upper level student usually presents for various causes and in various areas, but generally where we rejection, apathy, disinterest is in the tasks that involve investigating. Teens often use discussion as a way of practicing new skills to explore the nuances of a topic and present a case from other points of view, which is why their attitude may be questioned, taking ude may be questioned, taking The present research presents the results obtained from a study carried out at a university located in y, regarding apathy. A 95% reliability and 5% error were used in the study. For the analysis a questionnaire was adapted, this instrument was proposed by Lopez and Sánchez (2010). As a result, the objective of research was achieved, the first cause hy in young people is the content of the subject and the teacher who teaches his subject. In addition, it was reached to know that students have more apathy are those of algebra and probability and statistics. In addition, approximately 35% of the students surveyed indicated that they chose to study this course because undertake demonstrations in Spain, France and Levy, Cummings and Fairbanks (1998) indicate that it is a quantitative reduction of voluntary behaviors, which consists of an emotional and cognitive deficit that can arise and be reversed from internal (self-activation) or external In addition, Marín (1996) (2012) argue that apathy is a behavioral syndrome or a dysfunction of the process that originates the actions induced by external stimuli or by their own; therefore, apathy occurs when the systems that generate and control the will are ) mentions that students' apathy or lack of interest in studies may be due to the absence of motivation, which may also be the negative effect of the proposed models and even a relation to the lack of an explicit link between the models social and school contents. Rivera (2007) mentions that apathy can be defined as a state of indifference or suppression. Panimboza (2015) mentions that apathy or school disinterest is the absence of passion to learn or acquire knowledge. Keywords: Apathy, causes, reliability. INTRODUCTION The apathy school implies lack of interest in learning. The student is physically present in the classroom, but his / her mind is blank or focused on his / her own concerns, or aimed at disturbing the development of the class, of which he / she feels alien and uncomfortable (Fingermann, 2010). Apathy is thus defined as the impassibility of mood and neglect, indolence, lack of vigor or energy (Abbagnano, 2004). For example, the apathy of Mexican society and its lack of interest in political issues when it comes to demanding transparency in corruption cases, limits young people to organize corruption cases, limits young people to organize to The apathy school implies lack of interest in learning. t in the classroom, but his / her mind is blank or focused on his / her own concerns, or aimed at disturbing the development of the class, of which he / she feels alien and Sánchez (2013) mentions that the apathy of the upper- level student usually presents for various causes and in various areas, but generally where we find a greater rejection, apathy, disinterest is in the tasks that Teens often use discussion as a way of practicing new skills to explore the nuances of a topic and present a case from other points of view, Apathy is thus defined as the impassibility of the mood and neglect, indolence, lack of vigor or energy (Abbagnano, 2004). For example, the apathy of Mexican society and its lack of interest in political issues when it comes to demanding transparency in @ IJTSRD | Available Online @ www.ijtsrd.com @ IJTSRD | Available Online @ www.ijtsrd.com | Special Issue Publication | November November 2017 P - 42
International Journal of Trend in Scientific Research and Development (IJTSRD) ISSN: 2456-6470 Special Issue of 2nd International Congress of Engineering it as something negative in the school setting instead of a possibility to generate interest and challenges in them that encourage their teaching-learning process. Another factor that has been perceived today is that students who enter college, many of them do not know the career they will study, are influenced by their peers to choose a career or their parents choose what their children will study in the university. college. A predominant factor in Mexico City, is that many students fail to enter the university that they want. GENERAL OBJECTIVE Diagnose the factors involved in the apathy of industrial engineering students. Specific objectives Understand the contextualization of apathy in school. university teachers the causes of the apathy of young first-come. THEORETICAL FRAMEWORK One of the main factors that shows the society and that is the cause of the apathy is the personal demotivation which causes a disinterest to participate in the joint activities. Flores, González and Rodríguez (2013) point out that anxiety in classes and especially in mathematics is everywhere, taking into account all the countries of the Organization for Economic Growth and Development (OECD), in half of children age 15 and over 60% of girls are concerned that they will find their math classes very difficult and will get low grades. Pérez (S / A) points out that higher education in Mexico faces very important challenges: The inequality between supply and demand, lack of resources in a large part of the population to access private education, low educational level in the upper middle level, socioeconomic conditions, among many others, have determined a difficult panorama for the young people of our country. According to Cabrera, Peral and Barajas (2012) indicate that the concept of apathy was more accepted in popular culture after the First World War, being described as one of several forms of war neurosis characterized by a feeling of emotional numbness and indifference to normal social interaction. Valentini (2008) points out that apathy in school settings is not a static phenomenon to be studied in a laboratory; has a dynamic destiny: it is born, develops, leads to disinterest, disinterest engenders boredom and it shows many faces: passivity, inertia, sadness and even anger and from there begins to approach the other pole of apathy: rebel aggression. Panimboza (2015) points out that school disinterest is a fact that comes 50 years ago. In spite of the technological advance, the neglect of learning is a social factor that has increased. Poor performance is one of the factors that is caused by the poor qualifications that adolescents have obtained. The analysis of apathy by studies necessarily leads to absenteeism in general, absence may be due to factors due to socioeconomic problems (for example, lack of money for transport, clothes, shoes, etc.), so that they Know relevant facts about the causes and consequences of apathy in school. Calculate the representative sample using 95% confidence. Adapt the questionnaire proposed by Lopez and Sánchez (2010) in the representative sample. Analyze questionnaires applied to the representative sample. the results obtained from the Evaluate the results obtained from the analysis of the questionnaires. JUSTIFICATION In the investigation, apathy was taken as the object of study in the young people who have just entered the industrial engineering career, due to the fact that they have noticed a great lack of interest in learning, it has also been possible to see desertion rates, which is seen reflected in low academic performance from the first semester of admission to their study. The student is apathetic to any circumstance in the classroom, does not make the least effort to increase his grades, to study subjects assigned, to participate in activities. This research aims to reach the causes that originate this phenomenon, and with this to make known to @ IJTSRD | Available Online @ www.ijtsrd.com | Special Issue Publication | November 2017 P - 43
International Journal of Trend in Scientific Research and Development (IJTSRD) ISSN: 2456-6470 Special Issue of 2nd International Congress of Engineering take care of their other little brothers and sisters to help with household chores or illness (Heredia, 2000). According to data from INEGI (2015), school attendance among young people aged 14 to 24 in 2000 was 33%, while for the year 2015 it was 44%. The difference by sex is slightly more than one percentage point with 45% of men and 44% of women. Tinto (2001) reports that 50% of all dropouts occur before the second year, and that 40% of all students fail to graduate. On the other hand, it has been detected that a student who arrives at the university with high expectations personal demonstrates a lack of motivation because it was not what they expected. The Economist (2014) indicated that the Ministry of Public Education (SEP) has the goal of reducing from 15 to 9 percent the dropout rate in high school by 2018. On the other hand, Anguiano (2015) points out that family violence, a personal or social decision, but, above all, poverty, are the reasons, among others, that led to one million 470 thousand 718 children and young people to abandon their studies; is a phenomenon that goes up, which means a strong economic impact that, according to figures from the Secretary of Public Education, represented a cost of 34 billion pesos for the country. Negrete and Leyva (2013) and Valdez and Aguilar (2014) suggest that this social phenomenon may be due to several factors, such as lack of job opportunities, limited educational access, lack of economic resources, personal dissatisfaction, insecurity and loss of the adolescents' sense of life. In the university environment, it is no exception. According to Gracia (2015) studies conducted by the OECD, the countries that make up the Organization for Cooperation and Development), our country along with Turkey are the countries that have the most university dropout. Montes de Oca (2015) points out in its article, according to INEGI data in the same year, through the Ministry of Public Education (SEP), about 45 thousand students enter the university annually; only 7 thousand 200 finish the race and 5 thousand 600 are titled. Mendoza (S / A) points out that in Mexico only 16% of young people and adults have a bachelor's degree or degree, the lowest percentage among the 34 countries that make up the Organization for Economic Cooperation and Development (OECD). The situation is so serious that only 21% of Mexicans aged 25-34 have a university degree, a number that falls to 12% when it comes to the population between 55 and 64 years. Miranda and Balcazar (2010) point out that the lack of illusions and ambitions affects the young person in all spheres of life, including the work aspect, where he considers that he has few opportunities for growth, success and professional development. It lacks clarity and recognition of its own worth. Universia Mexico (2015) mentions that apathy, disinterest, conformity, little solidarity and little commitment to society, that is the radiography of young university students and this is a reality that institutions of higher education have also paid for not counting with appropriate instances to boost values among youth. De la Cruz, Sánchez, y Urrutia (2008) mentions that an engineering has the objective of developing a logical thinking in the students to solve problems with ingenuity. They are said to be harsh engineering because of high failure rates in mathematics-related subjects. METHODOLOGY Instrument The instrument of data collection that was used was the one proposed by Lopez and Sánchez (2010). Once this instrument was analyzed, a new one was adapted, which consisted of only 9 questions. Population and sample The research was carried out in a university located in the Iztapalapa delegation. We studied 3 groups of the first semester of the Industrial Engineering career, the population was a total of 65 students. The sample of the student population was determined. The formula used was the one proposed by Dr. Bolaños (2012), this formula is used for finite or known populations. The formula is as follows: N i ) 1 ( 2 Z * N * p 2 * q n 2 Z * p * q @ IJTSRD | Available Online @ www.ijtsrd.com | Special Issue Publication | November 2017 P - 44
International Journal of Trend in Scientific Research and Development (IJTSRD) ISSN: 2456 Special Issue of Special Issue of 2nd International Congress of Engineering Scientific Research and Development (IJTSRD) ISSN: 2456 Scientific Research and Development (IJTSRD) ISSN: 2456-6470 Where: n: sample size N: population size Z: value corresponding to the gauss distribution, for the investigation Z = 95%, which is equal to 1.96. p: expected prevalence of the parameter to be evaluated, if not known (p = 0.5), which makes the sample size larger. q: 1 - p (if p = 70%, q = 30%) i: error expected to be committed if it is 5%, i = 0.05 The development of the formula is as follows: * 65 * ) 96 . 1 ( The study indicated that of a population of 65 students, using 95% confidence and 5% of error allowed, the study will require 56 students. ANALYSIS OF RESULTS As a first observation, Table 1 is shown, this table represents the number of students evaluated by age and their gender. The results show that the age that proliferated between the representative sample was 15 and 20 years. Because it is the first semester, this age is the average age at which a student enters college. Also, the gender that excelled more was the feminine gender. Table 1. Example of number of students evaluated by age and gender. AGE 15 - 20 21-25 26-30 More than 30 29 19 5 3 32 24 Z: value corresponding to the gauss distribution, for the investigation Z = 95%, which is equal to 1.96. Z: value corresponding to the gauss distribution, for the investigation Z = 95%, which is equal to 1.96. prevalence of the parameter to be evaluated, if not known (p = 0.5), which makes the sample size prevalence of the parameter to be evaluated, if not known (p = 0.5), which makes the sample size i: error expected to be committed if it is 5%, i = 0.05. The development of the formula is as follows: 2 5 . 0 * 5 . 0 * 62 42 . 62 . 42 n 55 . . 71 56 9604 . 0 ) 1 2 2 . 0 16 1204 . 1 . 0 ( 05 ) ( 65 1 ( . 1 96 ) 5 . 0 * 5 . 0 * The previous figure shows that the majority of first semester students associate apathy with abandonment. This result may be that if a student is studies, he is likely to drop them. For the second questionnaire of the adapted questionnaire, Figure 2 represents an example of the weights obtained. The study indicated that of a population of 65 students, using 95% confidence and 5% of error allowed, the study will require 56 students. The previous figure shows that the majority of first semester students associate apathy with abandonment. This result may be that if a student is apathetic in his studies, he is likely to drop them. For the second questionnaire of the adapted questionnaire, Figure 2 represents an example of the As a first observation, Table 1 is shown, this table number of students evaluated by age and their gender. The results show that the age that proliferated between the representative sample was 15 and 20 years. Because it is the first semester, this age is the average age at which a student enters college. so, the gender that excelled more was the feminine QUESTION 2 QUESTION 2 30 26 Table 1. Example of number of students evaluated Te gusta Te manda Te manda Figure 2. Example of the results for question 2 le of the results for question 2. GENDER M The above figure shows that a little average first-semester students like to attend school. But, alarming, is that a little less the average students, attend school because they send them. For the third question of the adapted questionnaire, Figure 3 represents an example of the obtained. F The above figure shows that a little more than the semester students like to attend school. But, alarming, is that a little less the average students, attend school because they send them. For the third question of the adapted questionnaire, Figure 3 represents an example of the results For the first question of the adapted questionnaire, Figure 1 represents an example of the results obtained. For the first question of the adapted questionnaire, 1 represents an example of the results QUESTION 1 QUESTION 3 QUESTION 3 23 30 12 20 20 8 7 6 6 0 0 Me gusto No me quede en otra No me quede en otra escuela escuela Mis padres la escogieron Figure 1. Example of the results for question 1. Figure 1. Example of the results for question 1. Figure 3. Example of the results for question 3 question 3. le of the results for @ IJTSRD | Available Online @ www.ijtsrd.com @ IJTSRD | Available Online @ www.ijtsrd.com | Special Issue Publication | November 2017 Publication | November 2017 P - 45
International Journal of Trend in Scientific Research and Development (IJTSRD) ISSN: 2456 Special Issue of Special Issue of 2nd International Congress of Engineering Scientific Research and Development (IJTSRD) ISSN: 2456 Scientific Research and Development (IJTSRD) ISSN: 2456-6470 The above figure indicates that most of the representative sample of students chose their career because they liked it. On the other hand, slightly less than the average student chose another school. And a few students responded that they chose their career because their parents chose the race. For the fourth question of the adapted questionnaire, the figure represents an example of the weights obta The above figure indicates that most of the representative sample of students chose their career because they The above figure indicates that most of the representative sample of students chose their career because they liked it. On the other hand, slightly less than the average student chose his career because he did not stay in another school. And a few students responded that they chose their career because their parents chose the race. another school. And a few students responded that they chose their career because their parents chose the race. his career because he did not stay in For the fourth question of the adapted questionnaire, the figure represents an example of the weights obta For the fourth question of the adapted questionnaire, the figure represents an example of the weights obtained. QUESTION 4 30 26 Si No Figure 4 Figure 4. Example of the results for question 4. The above figure indicates that the majority of the representative sample of students do not like their career, which is worrying. Likewise, slightly less than the average number of students For the fifth question of the adapted questionnaire, the figure represents an example of the results obtained. For the fifth question of the adapted questionnaire, the figure represents an example of the results obtained. The above figure indicates that the majority of the representative sample of students do not like their career, The above figure indicates that the majority of the representative sample of students do not like their career, which is worrying. Likewise, slightly less than the average number of students surveyed do like their careers. surveyed do like their careers. For the fifth question of the adapted questionnaire, the figure represents an example of the results obtained. QUESTION 5 23 15 11 5 2 0 1 2 3 Más de 3 Figure 5 Figure 5. Example of the results for question 5. The above figure shows that the majority of students than average percentage of the representative sample feels apathetic in a subject. In addition, there are students who feel apathetic with three subjects and, to make matters worse, there are studen more than three subjects. these results are worrying, since, of the representative sample, only five students do not feel apathetic. For the sixth question of the adapted questionnaire, the figure represents an example of the wei For the sixth question of the adapted questionnaire, the figure represents an example of the wei For the sixth question of the adapted questionnaire, the figure represents an example of the weights obtained. The above figure shows that the majority of students surveyed in two subjects feel apathetic. Likewise, a less than average percentage of the representative sample feels apathetic in a subject. In addition, there are students who feel apathetic with three subjects and, to make matters worse, there are students who more than three subjects. these results are worrying, since, of the representative sample, only five students do more than three subjects. these results are worrying, since, of the representative sample, only five students do surveyed in two subjects feel apathetic. Likewise, a less than average percentage of the representative sample feels apathetic in a subject. In addition, there are students ts who feel apathetic with @ IJTSRD | Available Online @ www.ijtsrd.com @ IJTSRD | Available Online @ www.ijtsrd.com | Special Issue Publication | November 2017 Publication | November 2017 P - 46
International Journal of Trend in Scientific Research and Development (IJTSRD) ISSN: 2456 Special Issue of Special Issue of 2nd International Congress of Engineering Scientific Research and Development (IJTSRD) ISSN: 2456 Scientific Research and Development (IJTSRD) ISSN: 2456-6470 QUESTION 6 25 20 5 5 3 3 0 Figure 6 Figure 6. Example of the results for question 6 le of the results for question 6. The previous figure shows that the majority of students surveyed give as the first factor of their apathy to the content of the subject. Another factor that students attribute to their subject. In addition, peers are another factor that the students surveyed attribute to their factors in apathy, according to the representative sample of students are school schedules and facil For the seventh question of the adapted questionnaire, the figure represents an example of the results obtained. The previous figure shows that the majority of students surveyed give as the first factor of their apathy to the The previous figure shows that the majority of students surveyed give as the first factor of their apathy to the content of the subject. Another factor that students attribute to their apathy is the teacher who teaches the subject. In addition, peers are another factor that the students surveyed attribute to their factors in apathy, according to the representative sample of students are school schedules and facil factors in apathy, according to the representative sample of students are school schedules and facilities. apathy is the teacher who teaches the subject. In addition, peers are another factor that the students surveyed attribute to their apathy. Less influential For the seventh question of the adapted questionnaire, the figure represents an example of the results obtained. For the seventh question of the adapted questionnaire, the figure represents an example of the results obtained. QUESTION 7 23 15 6 6 3 3 Figure 7 Figure 7. Example of the results for question 7. The previous figure indicates that, according to the representative sample of communication workshop is the one they like most. Also, the subject of systems theory is the second most liked by students. For the eighth question of the adapted questionnaire, the figure represents an example of the The previous figure indicates that, according to the representative sample of students surveyed, the subject of communication workshop is the one they like most. Also, the subject of systems theory is the second most liked communication workshop is the one they like most. Also, the subject of systems theory is the second most liked students surveyed, the subject of For the eighth question of the adapted questionnaire, the figure represents an example of the For the eighth question of the adapted questionnaire, the figure represents an example of the weights obtained. @ IJTSRD | Available Online @ www.ijtsrd.com @ IJTSRD | Available Online @ www.ijtsrd.com | Special Issue Publication | November 2017 Publication | November 2017 P - 47
International Journal of Trend in Scientific Research and Development (IJTSRD) ISSN: 2456 Special Issue of Special Issue of 2nd International Congress of Engineering Scientific Research and Development (IJTSRD) ISSN: 2456 Scientific Research and Development (IJTSRD) ISSN: 2456-6470 QUESTION 8 24 22 5 5 0 0 Figure 8 Figure 8. Example of the results for question 8. The previous figure shows that, according to the representative sample of students surveyed, the subject of algebra is the least liked by them. Likewise, the subject of probability and students. For the ninth question of the adapted questionnaire, the figure represents an example of the results obtained. For the ninth question of the adapted questionnaire, the figure represents an example of the results obtained. The previous figure shows that, according to the representative sample of students surveyed, the subject of The previous figure shows that, according to the representative sample of students surveyed, the subject of algebra is the least liked by them. Likewise, the subject of probability and statistics is the second least liked by statistics is the second least liked by For the ninth question of the adapted questionnaire, the figure represents an example of the results obtained. QUESTION 9 20 10 10 9 8 8 7 6 5 5 4 3 3 3 3 2 2 1 1 1 0 0 1 2 3 4 5 6 7 8 9 10 11 Figure 9 Figure 9. Example of the results for question 9. The previous figure shows that, according of them feel on an apathy scale of 8. In addition, there are students who are on the apathy scale of 6 and 7. It is worrying to note that the scale of 1 to 10 in apathy, of the 56 student be below the 5 scale. CONCLUSIONS The objective of the research was achieved; objective was the diagnosis of the factors that intervene in the apathy of the students of industrial engineering of the first semester. Also in the study was learned that the first cause of apathy in young was learned that the first cause of apathy in young The previous figure shows that, according to the representative sample of students surveyed, the vast majority of them feel on an apathy scale of 8. In addition, there are students who are on the apathy scale of 6 and 7. It is worrying to note that the scale of 1 to 10 in apathy, of the 56 students surveyed, only 8 students were found to to the representative sample of students surveyed, the vast majority of them feel on an apathy scale of 8. In addition, there are students who are on the apathy scale of 6 and 7. It is s surveyed, only 8 students were found to people is the content of the subject and th who teaches his subject. In addition, in the investigation it was obtained to know that the students have more apathy in the subjects of algebra and probability and statistic. This is an alarming situation, since these two subjects are pillars fo within the curriculum and, above all, are matters that within the curriculum and, above all, are matters that people is the content of the subject and the teacher who teaches his subject. In addition, in the investigation it was obtained to know that the students have more apathy in the subjects of algebra and probability and statistic. This is an alarming situation, since these two subjects are pillars for future subjects achieved; this objective was the diagnosis of the factors that intervene in the apathy of the students of industrial engineering of the first semester. Also in the study @ IJTSRD | Available Online @ www.ijtsrd.com @ IJTSRD | Available Online @ www.ijtsrd.com | Special Issue Publication | November 2017 Publication | November 2017 P - 48
International Journal of Trend in Scientific Research and Development (IJTSRD) ISSN: 2456-6470 Special Issue of 2nd International Congress of Engineering 10)Gracia Universitaria en México. Firmas. Grupo Milenio. an industrial engineer must know and master. In addition, approximately 35% of the students surveyed indicated that they chose to study this course because they had not stayed in the university they wanted. For future research, it is suggested that a study of the contents of all the subjects of new entry be carried out, in order to revise its content, to update said content to be comprehensible, measurable and competitive. Likewise, it is suggested to review the profile of the teachers who teach the subjects of new admission and to propose to the best ones of their area so that these teachers love the students and can understand and know the industrial engineering. Hernández, M. (2015). Deserción 11)Heredia, S. (2000). La apatía del alumno por los estudios. Proyecto de innovación docente. Secretaria de educación pública. Deporte del estado de Campeche. Universidad Pedagógica Nacional. Unidad UPN 042. Ciudad del Carmen, Campeche. 12)INEGI. (2015). Asistencia escolar. Cuéntame. INEGI. 13)Levy, M.L., Cummings, J.L. y Fairbanks, L.A. (1998). Aphaty is not depression. Journal Neuropsychiatry & Clinical Neuropsychiatry, 314-319. REFERENCES 14)López Aguilar, N. G. y Sánchez Dorantes, L. (2010). El aburrimiento en clases. Procesos Psicológicos y Sociales Vol. 6 Año 2010 No. 1 y 2. 1)Abbagnano, N. (2004). Diccionario de Filosofía. México: FCE. 2)Anguiano, F. (2015). Por pobreza y violencia familiar, crece la deserción escolar en México. Formato7. 15)Lurgal, L. (1976). El fracaso y el desinterés escolar. Editorial Gedesa S.A. 16)Marín, R.S. (1996). Apathy: Concept, syndrome, neural mechanisms, and treatment. Semminars in Clinical Neuropsychiatry, 304-14. 3)Bolaños Rodríguez, E. (2012). Muestra y Muestreo. Asignatura: Desarrollo Tecnológico. Área Académica: Gestión Tecnológica. Escuela Superior e Tizayuca. Universidad Autónoma de Hidalgo. Estadística para el 17)Mendoza Rojas, M. (S/A). México, último lugar en población con estudios de licenciatura. Publimetro. 4)Cabrera, A., Peral, V. y Barajas, M. (2012). Apatía: síndrome o síntoma. Una revisión del concepto. Psiquis, 171-181. 18)Miranda, A. y Balcazar, M. (2010). La apatía del joven mexicano. Opinión. Expansión. 19)Montes de Oca, C. (2015). De 45 mil universitarios, sólo 7 mil terminan la carrera: Inegi. TV Zac S.A. de C.V. 5)Ceballos, M. A. (2011). Apatía, frena a jóvenes mexicanos. Diario 24 hrs. 6)De la Cruz, J., Sánchez, J., y Urrutia, C. (2008). El proceso de enseñanza aprendizaje de las matemáticas en ingeniería. 20)Negrete, R. y Leyva, G. (2013). Los NiNis en México: una aproximación critica a su medición. Realidad, datos y espacio. Revista Internacional de Estadística y Geografía. 7)El Economista. (2014). SEP busca reducir el porcentaje de abandono escolar. Sociedad. El Economista. 21)Panimboza Roca, G. L. (2015). Análisis del rendimiento escolar de los adolescentes del 8vo, 9no, 10mo año para la implementación de un programa en la unidad educativa “JOHN F. KENNEDY” de la Ciudad de Salinas. Carrera de Comunicación Social. Facultad de Comunicación Social. Universidad de Guayaquil. Ecuador. 8)Fingermann, Educación. La guía. H. (2010). Apatía escolar. 9)Flores Torres, I., González Cruz, G. y Rodríguez Rivera, I. (2013). Estrategias de enseñanza para abatir la apatía del alumno de secundaria. Revista Iberoamericana para la Investigación y el Desarrollo Educativo. 22)Panimboza Roca, G. L. (2015). Análisis del rendimiento escolar de los adolescentes del 8vo, 9no, 10mo año para la implementación de un @ IJTSRD | Available Online @ www.ijtsrd.com | Special Issue Publication | November 2017 P - 49
International Journal of Trend in Scientific Research and Development (IJTSRD) ISSN: 2456-6470 Special Issue of 2nd International Congress of Engineering 26)Tinto, V. (2001): Rethinking the first-year college. Higher Education Monograph Series. programa en la unidad educativa John F. Kennedy de la Ciudad de Salinas. Carrera de Comunicación Social. Facultad de Comunicación Universidad de Guayaquil. Guayaquil. Ecuador Social. 27)Universia México. (2015). Preocupa falta de valores en jóvenes a instituciones de educación superior. Educación. Universia México. 23)Pérez Valencia, I. (S/A). La apatía de los universitarios. WordPress.com. 28)Valdez M., J.L. y Aguilar, Y. (2014). La configuración de la apatía. Seminario de Investigación. Toluca, México. 24)Rivera, I. F.-G.-I. (2007). Estrategias de Enseñanza para Combatir la Apatía del Alumno de Secundaria. California - EE.UU.: Revista Iberoamericana para la Investigación y el Desarrollo Educativo. 29)Valentini, R. (2008). Reflexiones sobre el fenómeno de la apatía en ámbitos escolares. Artículo. Educar. Org. 25)Sánchez Cabrera, F. A. (2013). Apatía en el estudiante en tareas de investigación. Publicación no. 11. Revista Iberoamericana Investigación y el Desarrollo Educativo (RIDE). 30)WordReference. Apatía. WordReference.com para la @ IJTSRD | Available Online @ www.ijtsrd.com | Special Issue Publication | November 2017 P - 50