Download
1 / 22
220 likes | 349 Views
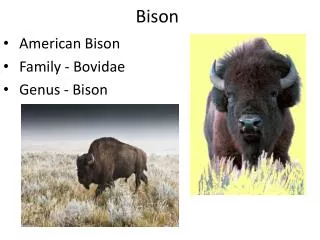
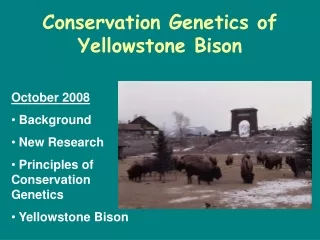
Status - Yellowstone Bison Population. August 2008 Abundance Life History Movements Genetics Brucellosis IBMP Implications. Abundance – 2008 Annual Population Estimate. Park wide 3,000 bison in July 2008 2,500 adults and yearlings from winter 2007-2008

E N D
Status - Yellowstone Bison Population August 2008 • Abundance • Life History • Movements • Genetics • Brucellosis • IBMP Implications
Abundance – 2008 Annual Population Estimate Park wide 3,000 bison in July 2008 2,500 adults and yearlings from winter 2007-2008 Less winterkill than expected 500 calves of the year Central Interior 1,500 bison (1,300 adults and yearlings; 200 calves) Northern Range 1,500 bison (1,200 adults and yearlings; 300 calves) Next Park-wide Distribution Survey in December 2008
Life History Age structure AdultYearlingCalf Park wide 68% 12% 20% Central Interior 70% 12% 18% Northern Range 66% 12% 22%
Life History Sex Ratio – males per 100 females
Life History • Survival • Annual adult, female survival = 91% (excluding risk management and hunter removals) • Annual adult female survival = 83% (with risk management and hunter removals) • Pregnancy • Depends on age and disease status • 90% of sero-negative, pregnant bison • 20% lower in sero-positive bison
Life History Birth Synchrony Concurrent with the emergence of spring forage Maximizes calf growth prior to weaning Peak calving period = April 25 to May 25 (80% of births)
Movements • Streams strongly influence bison travel • Roads may facilitate movements in some areas. • Autumn-winter movements on the Northern Range follow river corridors • Autumn-winter movements from the Central Interior are highly variable • West only (50%) • North only (31%) • West early, then north later (8%) • Stay in Central Interior (11%)
Movements Northern Range Winter Movements
Movements Central Interior Ranges Winter Movements
Movements Few bison stay in Pelican/Hayden system all winter
Movements Pelican Creek to Gardiner Basin in 12 days
Movements Madison Junction to Gardiner Basin in 3 days to 3 weeks
Movements Early arrivals in Gardiner Basin (Oct. to Dec.) -Central Interior Bison
Movements February Peak of movement to boundary ranges April
Genetics • Population sub-division • Removals affects genetic diversity • University of Montana – effects of risk management removals on conserving diversity
Brucellosis • 2008 population sero-prevalence = 45 % • Long-term estimate = 40-60 % sero-positive • Extensive data set from winter (2007-2008) • * ~ 400 bison sampled for culture • * ~ 1600 bison sampled for serology • Culturing of samples in progress • Sero-prevalence is variable by age
IBMP Implications • Start winter 2008-2009 with 2,900-3,000 bison • Central Interior herd reduced to 1,500 and Northern Range herd increased to 1,500 • Natural winterkill and predation mortality average ~10% or 300 bison • MT hunt and treaty harvest expected ~5-7% or 150-200 bison • Increased probability of large movement from Northern Range • IMBP risk management removal limited to a total <300 bison