Download
1 / 28
280 likes | 389 Views
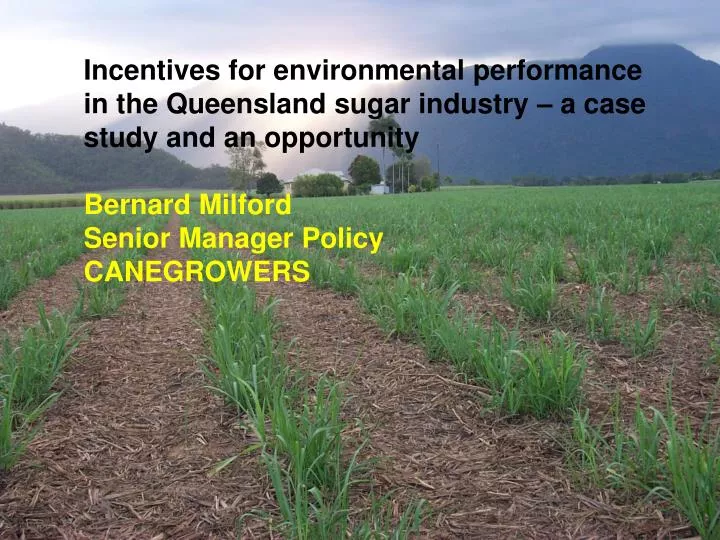
Incentives for environmental performance in the Queensland sugar industry – a case study and an opportunity Bernard Milford Senior Manager Policy CANEGROWERS. Program 1 (1999-2002) Cane, dairy, F&V, Cotton/grains Irrigation focused Extension, incentives and R&D.

E N D
Incentives for environmental performance in the Queensland sugar industry – a case study and an opportunity • Bernard Milford • Senior Manager Policy • CANEGROWERS
Program 1 (1999-2002) Cane, dairy, F&V, Cotton/grains Irrigation focused Extension, incentives and R&D Rural Water Use Efficiency 1 CASE STUDY RWUE1 aimed to increase WUE by 6% & 70% of farmers at BMP
Rural Water Use Efficiency 1 A PARTNERSHIP BETWEEN • Mills & local productivity groups involved • 16 Staff • 5 regions • Tablelands • Burdekin • Central • South – Bundaberg • South – Isis FUNDED BY
Rural Water Use Efficiency 1 • Productivity (CWI) increased to 8.2 t/ML • 210,000 ML of water saved over 4 years • An extra $135 M in production 83% of growers in irrigated areas participated in RWUE1 Government contributed $ 3.7 M Cane growers invested $16 M
Rural Water Use Efficiency 1 No Subsidy Total paid paid spent $’000 $’000 • System improvement 734 860 2718 • Recycling systems 936 1084 3650 • System change 101 1603 9263 • Scheduling equipment 77 79 196 • Water meters 42 44 151 • Consultancies 6 5 7 • Weather stations 2 2 19 • TOTAL 1898 3678 16 005
Rural Water Use Efficiency 1 • BMP Adoption 60% • Substantially meets BMP 25% • Meets min BMP 10%
What does this tell us? • Growers will support programs where capital infrastructure is supported • Capital infrastructure delivers increased productivity • This increase in capital delivers environmental outcomes – and a public good which is not costed • Could growers do more if these outcomes were fully costed?
The Public Good – Ecosystems Services Payment? • Reduced water runoff – less opportunity for nutrients & pesticides to be found in receiving water environment • Reduced impact on downstream ecological health • Reduction in groundwater rise e.g. Bundaberg and Burdekin • Less water use – improved environmental flows
Rural Water Use Efficiency 2 • Program 2 (2003-2007) • 5 Project Officers North Burdekin Central Bundaberg/Isis/ Maryborough/ Rocky Point
Rural Water Use Efficiency 2 Emphasis: • continue with irrigation efficiency • off-farm impacts such as water quality issues • new farming systems • rotation cropping eg link with “Grain-in-Cane” in Bundaberg (soybeans, chickpea) • controlled traffic farming
Rural Water Use Efficiency 2 Targets: • Increase irrigation water use efficiency by 2% • Increase crop water index by 2% • 50% grower adoption of best management practice to address regional priority • 50% participation in extension activities • 90% awareness of management techniques address regional priorities
Rural Water Use Efficiency 2 Targets: • 1000 ha of demonstration cane land to new cropping systems based on controlled traffic, fallow management, and increased planting density • 50% of growers recognise need for farm planning • 30% of growers participating in COMPASS program • 50% of growers aware of vegetation management practices
Rural Water Use Efficiency 2 • No actual incentive cash direct to farmers • $800k for group based activities
OPPORTUNITY New systems have huge potential • controlled traffic • permanent beds • row spacing to match equipment (1.8 m to 2 m) • dual row planting • zero till planting, sprayout of ratoon • dual disc, narrow-opening direct planter • legume fallow in raised beds • green cane trash blanket
Environmental benefits • Less runoff • Reduced N use • Increased soil organic carbon • Virtuous cycle • Reduced fertiliser use
Nitrogen marginally Phosphorus significantly Benefits of reduced runoff
% on sediment 15% 28% 34% 61% 89% 88% Reduce sediment losses
Benefits of improved organic C Improvement required
Benefits of improved organic C N rates may be reduced
Uptake of new systems Green cane trash blanket % of crop
Uptake of new systems Controlled traffic
Uptake of new systems Controlled traffic Presently all traffic runs on stool at some time
CTF in Sugarcane 2005 • Still at “early adopter” stage • Approx 10,000 ha out of 380,000 ha • about 3% • North – low CTF • Burdekin – 400 ha 1.8m, 2000 ha 3.0m • Central – 5000 ha new systems, 2000 ha CTF • South – 3000 ha CTF
CTF in Sugarcane 2005 Constraints • Capital cost $70k for GPS base station and tractor guidance • $30k for harvester, planter and other equipment modifications • Seven lean years • At present, equipment hire important and better designs for harvesters required
Opportunity for encouragement • Environmental and economic sustainability benefits available from faster uptake of new systems Opportunity to establish greater credibility
Opportunity for encouragement Sources of encouragement • Regional plans under SIIP • Sustainability & Restructuring grants • RWUE II & III and FMS FMS is about better farm management
Enormous progress been made over the last 20 years in soil control loss – this must have lead to improved water quality • Trash blanketing has been a widely adopted practice • leading to better soil health and reduced nutrient and herbicide applications. • This and other soil control loss practices are outlined in our CoP, COMPASS and are recognized in our FMS. Growers are adopting these best practices.