Download
1 / 24
240 likes | 326 Views
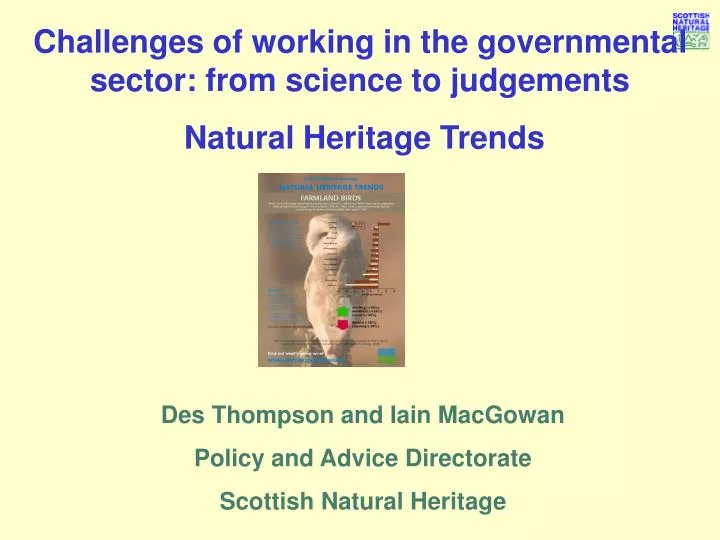
Challenges of working in the governmental sector: from science to judgements Natural Heritage Trends. Des Thompson and Iain MacGowan Policy and Advice Directorate Scottish Natural Heritage. Natural Heritage Trends. The Natural Heritage (Scotland) Act 1991. the natural heritage

E N D
Challenges of working in the governmental sector: from science to judgements Natural Heritage Trends Des Thompson and Iain MacGowan Policy and Advice Directorate Scottish Natural Heritage
Natural Heritage Trends The Natural Heritage (Scotland) Act 1991 the natural heritage … includes the flora and fauna of Scotland, its geological and physiographical features, its natural beauty and amenity … Scottish Natural Heritage general aims and purposes: - secure conservation and enhancement of nature - foster understanding and facilitate enjoyment of nature and outdoors
Natural Heritage Trends the problem issues diversity ………. remit variability …….... natural & social systems complexity ….…… environmental responses requirements evidence ……….. data change …..…… direction, rate, forecast credibility ……….. statistics
Natural Heritage Trends top 10 statistical problems • Sample size – insufficient / governed by resources • Sampling design – inefficient / stratification • Data – examine prior to analysis for peculiar values / important relationships • Statistical assumptions – normal / groups compared have similar variance • Sampling – non-random / systematically located • Pseudo-replication – within a large plot / small number of large plots • Misinterpretation – e.g. sampling errors do exist within permanent plots • Correction / calibration factor – difficult to measure / at one location / time • Complex 'black box' methods – can be sensitive to assumptions / parameters • Correlation – between successive values in a time-series / non-existent trends
Natural Heritage Trends statistical methods 1) Planning - method selection, experimental design, sampling strategy, data analysis and evaluation 2) Habitats - survey, evaluation and monitoring methods 3) Species - general & specific methods of survey and monitoring for the major taxonomic groups
Natural Heritage Trends land cover change National Countryside Monitoring Scheme 1947, 1973, 1988 Countryside Survey 1978, 1984, 1990, 1998, 2007 stratified random samples
Natural Heritage Trends indicators 1 Biodiversity – action plan outcomes 2 Protected Areas – site condition 3 Habitat condition – botanical indices 4 Landscape – spatial analysis 5 Habitat networks – spatial modelling 6 Information – direct & indirect provision 7 Climate – phenology 8 Recreation – activities & impediments 9 Greenspace – spatial analysis 10 Satisfaction – attitudes & participation 11 Birds – terrestrial, water, seabirds 12 Fresh water – ecological status 13 Marine – trophic indices 14 Tourism – natural heritage 15 Development – spatial analysis 16 Positive management – land and sea
Natural Heritage Trends recreation longitudinal tracking of trends - statutory right of access under part 1 of the Land Reform (Scotland) Act 2003 - participation in outdoor recreation - awareness of Scottish Outdoor Access Code (SOAC) Scottish Recreation Survey - ScRS is undertaken through Scottish Opinion Survey – a monthly omnibus - representative sample of the Scottish adult population ~ 1000/month - interviewing in the home with Computer Assisted Personal Interviewing (CAPI) - survey managed by TNS market information company
Natural Heritage Trends recreation non-probability, quota sampling - stratified by geographical distribution of Scottish population - 42 sample points of 25 interviews per point - different sampling points (random) each month ~ 500 points / annum - quotas for gender, age, socio-economic group and working status - results weighted by demographic profile from National Readership Survey (NRS) - quota sampling provides the most cost-effective approach - confidence intervals can only be estimated - sample size ~ 1,000 = confidence bands of +/-5% at the 95% confidence interval
Natural Heritage Trends marine plankton - Greek, meaning ‘wanderer’ or ‘drifter’ - micro-organisms of both plant (phyto-) and animal (zoo-) components - spend all / part of their life cycle suspended in the water column (pelagic) - phytoplankton are at the base of the marine food web - primary producers - upon which all higher trophic-level organisms in the sea depend - plankton ecosystems play an important role in biochemical cycles - important to larval stages of commercially important fish – e.g. cod and herring
Natural Heritage Trends marine Continuous Plankton Recorder - survey of seas around UK and North Atlantic Ocean over the past c. 50 years - plankton abundance & community composition throughout pelagic ecosystem - may be linked to environmental conditions - e.g. sea temperatures / pollution loading - trends x bio-geographical areas & key components of the plankton community a) phytoplankton biomass b) cold-water zooplankton / warmer-water zooplankton / Calanus abundance c) seabed organisms (larvae in the water-column)
Natural Heritage Trends marine phytoplankton biomass
Natural Heritage Trends marine statistical questions a) data behind the annual averages needs to be described - if in some years all observations were high / low then outliers are true - alternatively, possible errors in observations contributing to the mean b) if the spatial distribution of sampling locations has changed over time - temporal trends reported may in-part reflect the changing sampling c) trends - index approach good but average the start-point over (say) first 10 years - check diagrams carefully to ensure that running means are correct
Natural Heritage Trends marine simple linear regression - expect temporal autocorrelation in the residuals - coefficients of the line will be poorly estimated - standard errors will be too low - tests against a null hypothesis (no change) will reject null hypotheses too often - data often do not seem to follow a linear trend - log-transformation may be more appropriate - scattering of high observations
Natural Heritage Trends birds characteristics - short-lived, mobile, productive breeders - respond quickly through breeding output, survival, dispersal - near top of food web, widespread, easy to identify - range & abundance may reflect less-evident underlying conditions - relatively well-studied…lot of volunteers contribute data - popular and resonant - adopted as indicators of biodiversity and sustainable development
Natural Heritage Trends seabirds data characteristics - 24 species of breeding seabird from UK census c. 1970, 1985, 2000 - annual SMP survey (Seabird Monitoring Programme) commenced 1986 - SMP and census data are consistent at the UK level - modelling uses observed SMP counts to predict counts at un-surveyed colonies - counts & imputed counts from each colony summed to estimate each species - annual species abundance x region, feeding guild, nest type - sub-sets of species with similar ecological traits point to factors responsible
Natural Heritage Trends seabirds sampling - whole-colony counts & sub-sections (plots) - sample plots selected randomly & birds counted several times during season - takes account of counting error and variation in birds present at any given time - species differences = loss of information about variation within & between plots - of 24 species recorded in SMP, data were sufficient for 13 species - the statistical problem: only a sample of population counted each year, not all colonies counted annually need to estimate time-series trends from an incomplete time-series of counts
Natural Heritage Trends seabirds chain index of abundance - compares data from only those sites counted in consecutive years index in year x = 100 * (index in year x – 1) * (abundance in year x / abundance in year x-1) - index for first year of the time series (x= 0) is conventionally set to 100% - easy to implement and understand & past years are unaffected by new data - chaining discards non-consecutive data that have taken time & effort to collect - poor use of auxiliary plot data = unnecessarily high variability within indices - assumptions not transparent regarding biases, variability & uncertainty
Natural Heritage Trends seabirds Bayesian approach - explicit statistical model for each seabird species at each colony - estimation of unknown parameters by Bayesian inference - makes more effective and efficient use of the available data - scientific assumptions underpinning the model used to estimate parameters - fully quantifies levels of variability for colony, region and Scotland - initial development of an appropriate model is difficult & time consuming - intellectually and computationally
Natural Heritage Trends seabirds hierarchical model - modelled seabird abundance at colonies were combined to region & Scotland - assumption: counts were due to an observation and a hidden (latent) process - both involved a random component - a hierarchical approach linked plot & colony counts to underlying trends - assumption: seabird populations change in a relatively smooth way - observation model accounts for uncertainty in counting birds (recording error) - latent model describes the trend over time in the true number of birds - no / weak assumption of linearity or that trends across sites were synchronous
Natural Heritage Trends seabirds annual abundance trend 1986 - 2004 - Bayesian inference - repeated simulation to generate plausible parameter values - repetition quantifies uncertainty about the values of the parameters - models are more realistic than traditional statistical approaches - computationally intensive Markov chain Monte Carlo approach (LinBUGS) - valid for 8 species (fitting algorithm for 50,000 iterations + 10,000 ‘burn-in’) - relevant parameters converge to their equilibrium distribution - chaining method was applied to 5 species that violated the model assumptions
Natural Heritage Trends seabirds annual abundance trend 1986 - 2004 - aggregate (& individual) trend of breeding abundance of 13 species - uncertainty bands equivalent to 95% confidence intervals - sandeel-specialist seabirds predominantly in decline - not all species declined - gains as well as losses - various causes – food availability, predation, weather, disease - interactions between the causes – e.g. phenology
So…what’s the challenge? • Robust science • Understanding data and information limitations • Having clear questions • Making judgements on the available science • Being careful when straying from science into policy, opinion, advice or recommendations
Natural Heritage Trends snh.org.uk/trends