Download
1 / 21
210 likes | 546 Views
INDIA POWER SECTOR: CHALLENGES & INVESTMENT OPPORTUNITIES. New Delhi May 12, 2006 Salman Zaheer Lead Energy Specialist The World Bank. STRUCTURE OF PRESENTATION. Indian Power Sector Investment requirements (2007-12) Overview of market conditions India International Investors

E N D
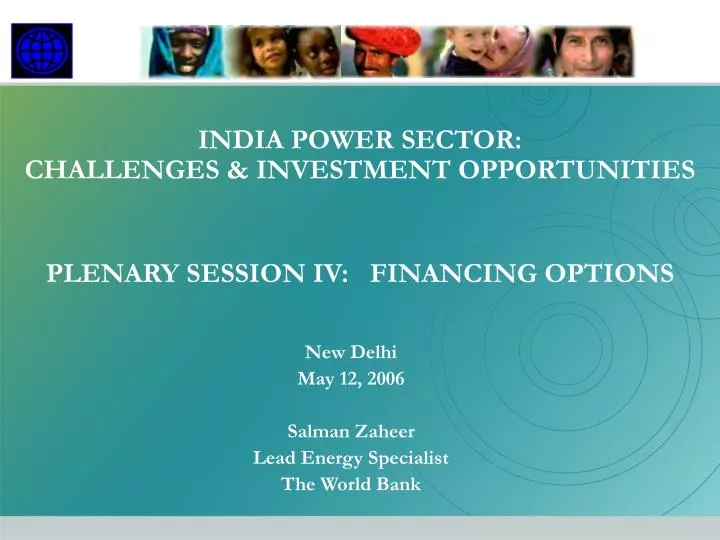
INDIA POWER SECTOR:CHALLENGES & INVESTMENT OPPORTUNITIES New Delhi May 12, 2006 Salman Zaheer Lead Energy Specialist The World Bank
STRUCTURE OF PRESENTATION • Indian Power Sector Investment requirements (2007-12) • Overview of market conditions • India • International Investors • Potential role of the World Bank Group (CAS 2005-08) • Concluding Remarks
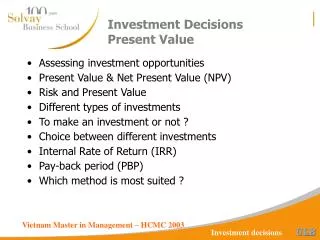
Investment Needs over 2007-12 period reasonably well established….. • Installed generation capacity to increase by about 60,000 MW (from 125,000 MW to 185,000 MW) • Of this about 20-30,000 MW hydro • Investment program estimated to cost US$100 billion • Generation – US$60 billion (Rs. 2,70,000 crores) • Transmission & Distribution – US$40 billion (Rs. 1,80,000 crores) • In addition: • About 20,000 MW of existing thermal capacity to be rehabilitated and modernized • Distribution networks to be upgraded and MIS strengthened • Human resources to be revitalized • And: • A “low carbon growth” strategy to be followed with international support (Post G8+5 meeting at Gleaneagles in 2005)
Indian market environment also broadly known….. • Industrial, commercial, urban household demand increasingly commercialized. Willing to pay cost-recovery tariffs provided: • Service is Efficient – not willing to pay for theft and utility inefficiency • Service is demand responsive – willingness to pay declines with outages, voltage fluctuations, billing hassles, etc. • Industrial and commercial demand now about 43-45% of total consumption. • 60% of Indian firms rely on costly captive or back-up self-generation (compared to 21% in China) • Urban household demand about 20-25% of total consumption • Urban consumers becoming wealthier and more service conscious • Rural – including agricultural - demand not ready for commercialization. Still needs effective government support
Some barriers to commercialization….. • Governance of distribution utilities • Over 40% of energy supplied into state transmission systems is lost, not billed, incorrectly billed or payment not collected • Reducing to 20% would save Rs. 15-20,000 crores/y ($3.3-4.4 billion) of generation cost (@Rs. 2/kWh) or generate 25% more revenue if billed at the average tariff (Rs. 2.77/kWh) • Sector is a conduit for about Rs. 20,000 crore ($4.5 billion) of poorly targeted and poorly accounted subsidies each year (from budget & cross-subsidies) • Even in advanced reforming states, only 55-65% of electricity sales metered • State regulatory commissions are still finding their feet • Tariffs are distorted and do not cover costs • Industry tariffs are high by international standards (about USc 8-10); agricultural tariffs (accounting for 25% of consumption) are well below cost • Data quality is improving but progress on energy accounting/audits is slow • Regulations on service quality and service obligations yet to be enforced • Limited outreach efforts to enhance public participation • Fuel supply bottlenecks • Early stages of competition and liberalization
India market environment …..(3) • Government of India policy response is appropriate: • Electricity Act, 2003 • National Electricity Policy (March 2005) • National Tariff Policy (January 2006) • Correct focus on: • Governance Commercialization Private participation • Competition Rural services • Key challenge: • Ramp up pace and quality of policy implementation – • What must be done to move from about $6 billion to $20 investment/year? • Overcome concerns and resistance at state level • Accelerated reform of distribution still a critical bottleneck • Resolve fuel supply bottlenecks • Engage the private sector • Let’s visit the views from some major international investors…
160.0 140.0 120.0 100.0 80.0 60.0 40.0 20.0 0.0 1990 1992 1994 1996 1998 2000 2002 2004 2006 2008 2010 2012 2014 2016 2018 2020 Global market environment – Demand for Power Investment - a large Growing Gap? Financing required for the Power Sector in Emerging Markets 1990 - 2020 Cumulative Sum ($Bn) $2,300 Bn High Investment Demand Scenario (3%) $1,900 Bn Gap covered by public financing, self - financing, donor funding, and rationing. Low Investment Total Power Investment ($Billion) Demand Scenario (2%) Private Capital Mobilized in Power Sector Historic Future Source: : World Bank, IEA, Deloitte Touche Tohmatsu Emerging Markets Group
Global market environment –Feedback from Power Investors Roundtable (World Bank 2004) The Target Group Firms that invest their own equity outside their home countries • Local/domestic firms not included • Lenders not included – they follow the equity sponsor The Target Universe 65 firms in final survey. An ever decreasing number: • 7 mergers • 7 exits from emerging markets • 2 went into receivership The Survey Instrument • A 7-page standardized survey to all firms • Sent by email/fax – follow-up phone calls. The Response Rate • 48 valid responses – a 75% response
International Power Investors – Firms Targeted • ABB Equity Ventures • AEP • AES Corp • Alliant Energy International • Alsons Consolidated Resources • Amata Power • Banpu Public Co. Ltd. • BG Group • BP Global Power • CHI Energy (Energia Global) • Chilectra • Cinergy Global Resources • CLP Power International • CMS Energy Corporation • Cogentrix Energy • Commonwealth Development Corp. • Covanta Energy • Delma Power • Duke Energy • Dynegy • E.ON Energie • Edison Mission Energy 23. El Paso Energy 24. Electricite de France International 25. Electricite de Portugal 26. Elyo 27. Endesa 28. EIF Group 29. Entergy Power Group 30. Eskom Enterprises 31. FondElec 32. Fortum 33. GE Capital Global Energy 34. GMS Power 35. HEI Power 36. Hydro Quebec 37. Ibedrola 38. Independent Power 39. InterGen 40. International Power 41. Keppel FELS Power 42. Korea Electric Power Company 43. Marubeni Power • 44. Mirant • 45. Mitsui & Co. • 46. NRG Energy • 47. Panda Energy • 48. PPL Global • 49. PSEG Global • 50. Reliant Energy • 51. Rolls-Royce Power Ventures • 52. Saur International • 53. Scudder Latin America Fund • 54. Sempra Energy • 55. Siemens Power Ventures • 56. Sithe Energies • 57. Statkraft International • 58. Steag AG • 59. Tomen Power • 60. Tractebel • 61. TransAlta • 62. TXU Corp • Union Energy • Union Fenosa • 65. Wartsila NSD 21
7 12 11 3 10 8 4 9 6 Consumer Payment Discipline Possibility of Vertical Integration Competitive Selection Domestic Borrowing Corruption Index Ranking Transition to Competitive Market Clear Rules for Exit Judiciary's Independence Government Efficiency Legal Protection of Investors Investment Grade Debt Rating Gov’t/Multilateral Guarantee What conditions are important? Minor Major Critical “Deal-breaker” Rated “Dealbreaker” Relative Rank 63% 1 3.57 Legal Protection of Investors' Rights 2 36% 3.11 3.11 40% 5 13% 2.98 15% 2.91 2.83 19% 2.83 19% 2.68 8% 2.66 10% 2.49 4% 4% 2.43 13% 2.00 2 9
Top Three Conditions Sought by Investors 1. Legal protection and framework defining investor rights 63% of firms rated it a “deal-breaker” – ranked 1 of 12 factors • “contract enforceability” • “clarity in market rules” [Brazil , Guatemala ] • “protection ‘to do business’ – labor laws, property rights; laws that work” • “enforceable exit strategy” [Separately ranked 4th] 2. Payment discipline and enforcement 40% of firms rated it a “deal-breaker” – ranked 2 of 12 factors • Both generation and distribution investors considered it important • “we cannot fix it on our own” – government support essential. • “worsening payment discipline – strong negative”. 3. Guarantee from Government or Multilateral 36% rated it a “deal-breaker” – overall rank 5 of 12 • “support needed till the business becomes commercial” • “why should we take on the risk of a bankrupt business?” • Interestingly not a determinant for success – “best” and “worst” experience. 10
Interesting Results – conditions not highly valued • Domestic borrowing costs and tenors inconsequential Ranked 10th of 12 factors – only 4% rated it critical • “domestic Debt markets – too shallow; unwilling to do limited/non-recourse” • “international banks exuberant in 1990s – future appetite uncertain” • Investors don’t value vertical integration. Ranked last • “each segment of value chain must be independently profitable” • “we are too specialized to consider vertical integration” • Transition to competitive market welcomed • “means to improve transparency” • “promotes other necessary legal and regulatory reforms” • “provides alternative markets” (for generation) 11
Why did investments succeed or fail? 1. Retail tariff level and cash-flow discipline 65% of firms rated it critical - First overall rank for success or failure • “we have learned enough to avoid countries with unsustainable retail tariffs” • “Government assurances to raise tariffs or provide subsidies – not very comforting”. • “Tariff levels should be high enough without subsidies” 2. Fair adjudication of tariff adjustments and disputes 50% of firms rated it a critical determinant of failure. Second rank in case of failure. • “new regulators show little appreciation of investor needs”. • “Regulators showing an increasing tendency to change rules and targets on which investment decisions are made”. 3. Operational Control and Management Freedom 60% of firms rated it a critical success factor. Second overall rank • Key to deriving value from investment – economies, cost reduction • Unanimous verdict that public-private operational partnerships are not important (lowest ranked) 4. Regulatory commitment sustained through long-term contract 50% of firms rated it a critical determinant of failure. Third overall rank • “a contract is a contract” • “if the contract looks cozy – it probably is” • “need to make sure that the contract is on firm economic and financial ground” 15
How Satisfied are Investors? – A Country Assessment • Being a small country is not a liability • Multiple entrants (over 4) – No dissatisfied investors • Latin America – Bolivia, Jamaica, Panama, Costa Rica, Guatemala, Nicaragua, Dominican Republic • Africa – Kenya, Morocco • Respecting contracts under stress • Thailand, Philippines • Czech Republic, Colombia, Argentina, Indonesia, China, Pakistan, India • Regulators perceived to be exercising “excessive” discretion and risk on the increase • India, Colombia, Brazil • Are regulators just doing their job – or are investor expectations unrealistic? 19
Factors that Enable and Attract Investment • Well-managed reform: Increasing ability of utility to generate internal cash for investment through – • cost reductions • timely tariff adjustments to recover the cost of supply, and • efficient collection of posted tariffs • Keeping the financial house in order: • Improving access to debt financing from domestic/international debt markets by maintaining profitable operation + acceptable debt service ratio • Reducing risk & maintaining a healthy regulatory environment: Attracting domestic & foreign equity funding - • creating and maintaining sector structure, regulatory and legal environment conducive to minimization of country/project investment risk
World Bank role in India: Conforming with Country Assistance Strategy (2005-08)… • State level (2-4 states) – Finance investments, provide advisory services and implementation support to: • Improve efficiency, service quality and governance of state utilities • National level program – Investment support to: • Develop hydropower potential in an environmentally and socially sustainable manner • Strengthen capacity of 1-2 state governments to manage and utilize hydro resources in an efficient and responsible manner • Reduce barriers for rehabilitating thermal power plants and improving their fuel efficiency (part of “low carbon growth” agenda) • Expand national transmission system to facilitate access and trade • Expand rural access and improve rural electricity services • Promote renewable energy development (through IREDA/MNES) • Analytical and advisory support to: • Build awareness and consensus around sector reform issues – governance of publicly-owned distribution utilities, open access, etc. • Improve regulatory effectiveness in infrastructure services
World Bank’s Assistance Program…(2) Current portfolio consists of the following operations: Project Loan AmtBalanceClosing Date Powergrid II $450 m $ 60.6 m June 2006 Powergrid III $400 m $400.0 m July 2011 Rajasthan Power $178 m $ 38.3 m June 2006 Renewable Energy II $112 m $ 45.1 m March 2007 Under Preparation: • Rampur Hydropower – 412 MW approx. $400 m (2006-07) • Thermal Power Rehab – 600 to 1000 MW ($120-140 m IBRD; $40-60 m GEF) Being Identified: • State utility development & reform – dialogue with 3-4 states • Rural electricity services – dialogue with Ministry of Power • Hydropower development – dialogue with Ministry of Power and 2 states
International Finance Corporation also has an active power portfolio in India… • Allain-Duhangan 192 MW hydropower – first for IFC on merchant basis • Powerlinks - Tala Transmission Project – Tata Power & Powergrid JV • Mini hydro – IHDC (2-5 MW projects); considering windpower • Considering financing private distribution companies (NDPL) • TA (with North American Rural Electrification Cooperatives Association) to PFC for rural electrification • Worldwide, IFC has a power portfolio of US$2.5 billion (11% of business) • Good performance to date • Invested (since 1990) in 14,815 MW of generation capacity and US$15.2 billion in aggregate project costs. The portfolio currently has: • 7 distribution clients; 5 transmission clients; • 61 projects in 33 countries
World Bank Group risk mitigation guarantees - to leverage private investment
IBRD Loans - Lending Terms (As per currently applicable waivers to Indian Portfolio)
In closing…. • World Bank is committed to helping India meet its power sector objectives: • Improve efficiency and quality of electricity distribution – key to “unblocking” internal resources • Expand rural access • Enable electricity trade and transmission of power • Develop hydropower and other renewable energy potential in an environmentally and socially sustainable manner • Reduce barriers for rehabilitating thermal power plants and improving their fuel efficiency – other financial support for a “Low Carbon Growth” strategy being formulated • Policy framework has improved considerably – regulatory frameworks are also becoming more competent and transparent. However: • Scale of investments needed cannot be mobilized unless enterprise level reforms, particularly of distribution companies, are ramped up • Private or public companies cannot fix cash inadequacy without government help AND • We know from painful experience that a policy environment that is lousy for the private sector will be lousy for the public sector too! 19