Download

1 / 19
190 likes | 264 Views
Plasmonic Sensors and Atomic Force Microscopy in Biology and Medicine Jason H. Hafner Department of Physics & Astronomy Rice University. LSPR Refractive Index Sensitivity. ( L ocalized S urface P lasmon R esonance). E. k. B. Chemically synthesized LSPR substrates. antibodies. SAM.

E N D
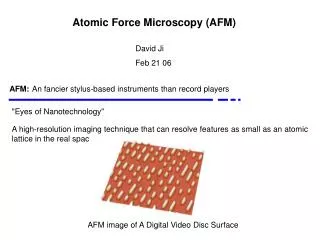
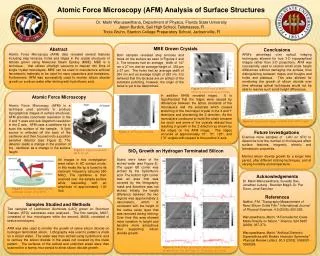
Plasmonic Sensors and Atomic Force Microscopy in Biology and Medicine Jason H. Hafner Department of Physics & Astronomy Rice University
LSPR Refractive Index Sensitivity (Localized Surface Plasmon Resonance) E k B
Chemically synthesized LSPR substrates antibodies SAM gold nanorod APTES glass Clean slide NR slide EM: 50x15 nm rods at 100/um2 Spectrum of slide: NIR peak at 800 nm
LSPR Immunoassay: Kinetics kon koff d Keq = kon/koff = 1.9 x 10⁹ M-1 koff = 6.5 x 10⁻⁵ s-1 kon = 1.3 x 10⁵ M-1s-1
LSPR Immunoassay: Specificity d specific binding nonspecific binding
Increased Sensitivity: Proximity A shorter SAM increases the signal rate. A smaller capture agent (aptamer) increases the signal rate for a much smaller target (thrombin, 30 kD). kon = 9140 M-1s-1 koff = 6.6 x 10⁻⁴ s-1 Keq = 1.33 x 10⁷ M-1 C16 4.7 nm/hr 6.5 nm/hr C11 6.1 nm/hr
Increased Sensitivity: Nanoparticle Shape Hybrid nanorod, nanosphere, and bipyramid substrate nanospheres nanorods LSPR shift (nm) bipyramids time (s)
Single Molecule LSPR Immunoassay Single particle dark field microspectroscopy under fluid flow: 50 nm Discrete blue-shifts correspond to single antigen unbinding, and occur at the correct rate:
miRNA injection LSPR Assay Immunoassay: -demonstrates real time molecular analysis -cannot compete with ELISA Basic Research: -analyze biomolecular interactions -useful in “resource poor” environment -explore non-microscope single particle analysis Biomedical: -microRNA detection
Plasmonic Nanobubbles Why gently heat something when you can blow it up? pulse: 0.5 ns, 0.1 J/cm2 bubble lifetime: 10 - 100 ns bubble size: 10 - 1000 nm
Plasmonic Nanobubbles Why gently heat something when you can blow it up? pulse: 0.5 ns, 0.1 J/cm2 bubble lifetime: 10 - 100 ns bubble size: 10 - 1000 nm
Plasmonic Nanobubbles: Drug Delivery Burst a liposome that contains dye and nanoparticles Fluorescence Scattering Before Bubble During Bubble After Bubble
l-DNA AFM Scan contrast = topography Lift Scan contrast = charge density Electrostatic Mapping with the AFM Lift scan AFM scan Lift height Johnson et al, Langmuir19, p10007 (2003)
Imaging Lipid Membranes DOPC / SM / Chol DOPC
Lipid Membrane d tr s Position Mica Mapping Lipid Membranes topography charge Lo La All lipids are zwitterionic – why the charge contrast?
Plasmonic Sensors: Colleen Nehl, Katie Mayer Plasmonic Nanobubbles: Dmitri Lapotko, Dan Wagner, Cindy Farach-Carson Membrane Electrostatics: Yi Yang, Katie Mayer hafner@rice.edu