Download
1 / 39
390 likes | 506 Views
A Visual Tour of the Effect of per Capita Income. -around the world in 30 minutes-. Bhutan. Per capita income: $174 Population doubling time: 30 years Male life expectancy: 47 years Female life expectancy: 49 years Fertility rate: 5.9 children/woman Population density: 94/sq mile.

E N D
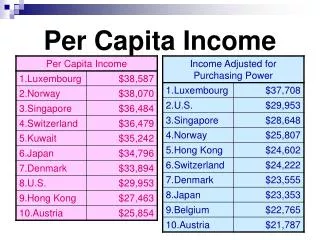
A Visual Tour of the Effect of per Capita Income -around the world in 30 minutes-
Bhutan • Per capita income: $174 • Population doubling time: 30 years • Male life expectancy: 47 years • Female life expectancy: 49 years • Fertility rate: 5.9 children/woman • Population density: 94/sq mile
Mali • Per capita income: $251 • Population doubling time: 20 years • Male life expectancy: 47 years • Female life expectancy: 50 years • Fertility rate: 7.1 children/woman • Population density: 22.6/ sq mile
Haiti • Per capita income: $374 • Population doubling time: 35 years • Male life expectancy: 53 years • Female life expectancy: 56 years • Fertility rate: 4.8 children/woman • Population density: 666/sq mile
China • Per capita income: $364 • Population doubling time: 49 years • Male life expectancy: 67 years • Female life expectancy: 71 years • Fertility rate: 2.2 children/woman • Population density: 335/ sq mile
Guatemala • Per capita income: $944 • Population doubling time: 24 years • Male life expectancy: 61 years • Female life expectancy: 66 years • Fertility rate: 5.4 children/woman • Population density: 252/ sq mile
Uzbekistan • Per capita income: $978 • Population doubling time: 33.4 years • Male life expectancy: 66 years • Female life expectancy: 73 years • Fertility rate: 4.4 children/woman • Population density: 132/sq mile
Thailand • Per capita income: $1697 • Population doubling time: 55 years • Male life expectancy: 66 years • Female life expectancy: 72 years • Fertility rate: 2.2 children/woman • Population density: 294/sq mile
Mongolia • Per capita income: $1820 • Population doubling time: 27 years • Male life expectancy: 61 years • Female life expectancy: 64 years • Fertility rate: 4.6 children/woman • Population density: 4/ sq mile
Cuba • Per capita income: $2,000 • Population doubling time: 78 years • Male life expectancy: 74 years • Female life expectancy: 79 • Fertility rate: 1.9 children/woman • Population density: 259/sq mile
Israel • Per capita income: $12,293 • Population doubling time: 15 years • Male life expectancy: 74 years • Female life expectancy: 78 years • Fertility rate: 2.2 children/woman • Population density: 751/ sq mile
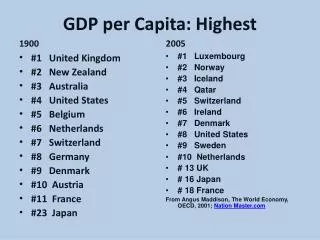
Japan • Per capita income: $26,824 • Population doubling time: 183 years • Male life expectancy: 76 years • Female life expectancy: 82 years • Fertility rate: 1.7 children/woman • Population density: 862/ sq mile
Kuwait • Per capita income: $16,380 • Population doubling time: -- years • Male life expectancy: 72 years • Female life expectancy: 76 years • Fertility rate: 3.7 children/woman • Population density: 174/ sq mile
United States • Per capita income: $26,000 • Population doubling time: 88 years • Male life expectancy: 74 years • Female life expectancy: 78 years • Fertility rate: 2.1 children/woman • Population density: 77/ sq mile
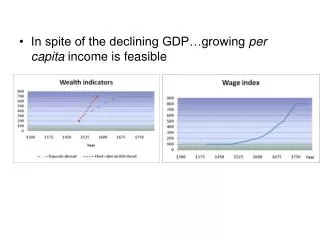
Relation of Values to Development • What are the results of increasing GNP? • Life Expectancy vs GNP • Well Being vs GNP (actual) • Well Being vs GNP (theoretical)
Environmental Problems in Survival Phase • Disease • Injury • Starvation • Environment is viewed as another external controlling force to be overcome; impacts result in a new environmental form that is neither better or worst
Environmental Problems in Pre-modern Phase • Plagues, famines • Wars • Drinking water contamination • Environment is viewed as nurturing and resistant to human impacts; however, big impacts can bring disaster to family
Environmental Problems in Modern Phase • Accidents • Water, wastewater and air pollution • Industrial, toxic, and hazardous wastes • Environment is viewed as a source of raw materials and as resistant to human impacts; big impacts can bring disaster to corporations and bureaucracies
Environmental Problems in Post-modern Phase • Crowding • Solid wastes • Non-point chemicals • Old age • Resource depletion • Large-scale accidents • Global disruption of natural cycles • Epidemics
Environmental Problems in Post-modern Phase • For individualist, impacts to the environmental are often seen as incremental and inconsequential. Environment is often seen as another consumptive good. • For egalitarian, any impact to the environment may be disastrous. Impacts are seen as additive. The environment is seen as a place to create the “good society.”
Important Environmental Values • Value of non-human life? • Preservation of richness and diversity of life forms? • No, minimal, or tolerable human impacts? • Sustainability? • Conservation of areas with no human impact?
Old Interaction of Technologies with Society Perceived Need Design It Build It Attempt sustainability Deal with Impacts
New Interactionof Technologies with Society Hierarchical Needs Survival Needs Seek sustainable systems Design, build, minimize impacts Egalitarian Needs Individual Needs