Download
1 / 30
300 likes | 362 Views
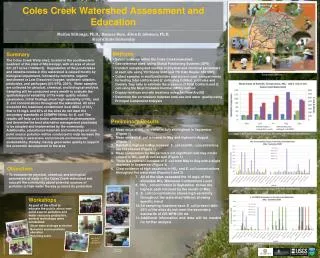
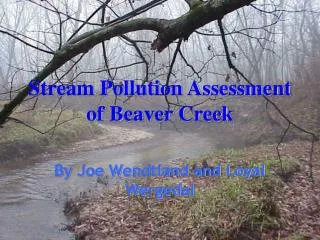
A Chemical and Microbiological Assessment of Brooklyn Creek. Highland IB Group 4 Students, Class of ‘14:

E N D
A Chemical and Microbiological Assessment of Brooklyn Creek Highland IB Group 4 Students, Class of ‘14: Brett Baldwin, Vanessa Borowicz, Josie Brune, Trenton Cameron, Pam Choi, Jon Daigle, Megan Ellis, James Galpin, Janelle Garrett, Mac Gold, Madison Goodspeed, Emily Haagerup, Tristan MacLean, Will Matous, Sam McInnes, Ben Obal, Athena Read, Katy Richards, Reina Stewart, Sarah Stewart Grantham, Audrey Smith, Anabelle St. Denis, Callum Thomas, Jack Thomas, Theo Truax, Zach Turple, Amy Walsh, Kim Webber
Brooklyn Creek Spawning stream for Coho & Chum
Brooklyn Creek Rainbow, sea-run, resident Cutthroat trout
Brooklyn Creek Miscellaneous flora & fauna
Brooklyn Creek Recognizing the first assessment: Matthew Arndt, Danny Atchison, Chelsea Eby, Ben Farnell, Sara Harrison, Kris Isenor, Morgan Jackson, Kim Seed, Dane Stabel, Dean Wall, Dallyn Willis February – May 2000(Additional data collected December 2000 – May 2001)
Brooklyn Creek Data Collection:May 22nd, 2013 Three sites: • Guthrie • Dogwood • Balmoral
Questions to Answer: • Define and/or explain the parameters assigned. • Why are these parameters useful/important in assessing stream health? • Explain the nature of the tests performed to assess these parameters, and the theory behind each test. • Where relevant, state the allowable levels for each parameter. • Present data and compare to allowable levels.
Group 1: pH, Temperature, Hardness, Turbidity Josie Brune, Audrey Smith, Reina Stewart, Sarah Stewart Grantham, Kim Webber
Group 2: Fecal Coliforms, Dissolved O2, Biological Oxygen Demand Janelle Garrett, Emily Haagerup, Ben Obal, Amy Walsh
Data Fecal Coliforms:
Data Biological Oxygen Demand:
Data Dissolved Oxygen:
Group 3: Total Suspended & Dissolved Solids, Conductivity Brett Baldwin, James Galpin, Athena Read
Data (Test minimum for TSS – 5 mg/L)
Group 4: Anion Concentration, Salinity Vanessa Borowicz, Megan Ellis, Mac Gold, Madison Goodspeed, Anabelle St. Denis
Group 5: Elemental Concentration Will Matous, Sam McInnes, Katy Richards, Theo Truax, Zach Turple
Data Experimental Results:
Data 2000/2001 Results:
Data % of Accepted Value Present (Experimental Data)
Data % Change from 2000/2001 Results
Group 6: Rate of Water Flow Trenton Cameron, Jon Daigle, Tristan MacLean, Callum Thomas, Jack Thomas
Data Calculating Average Cross-Sectional Area
Data Measuring Travel Time: Orange Test: Ping Pong Test:
Data Calculating Water Flow: Water Flow with Orange: Water Flow with Ping Pong:
Thanks To… North Island Laboratories Project Watershed