Download
1 / 55
550 likes | 656 Views
Houston’s Economic Outlook. Presented by Patrick Jankowski, Vice President Research Greater Houston Partnership. Presented by Jenny Philip, Manager of Economic Research Greater Houston Partnership. The Recession and Recovery. Cliffs Notes Version. Recession and Recovery.

E N D
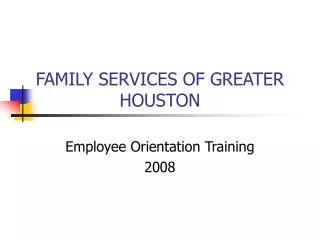
Houston’s Economic Outlook Presented by Patrick Jankowski, Vice President Research Greater Houston Partnership Presented by Jenny Philip, Manager of Economic Research Greater Houston Partnership
The Recession and Recovery Cliffs Notes Version
Recession and Recovery * Through August Source: Texas Workforce Commission
Recession and Recovery * Through August Source: Texas Workforce Commission
Recession and Recovery * Through August Source: Texas Workforce Commission
Recession and Recovery * Through August Source: Texas Workforce Commission
Percent of jobs recovered through Aug ’12Houston vs. Top 10 Metros 100% Source: U.S. Bureau of Labor Statistics
Percent of jobs recovered through Aug ’12Houston vs. Top 10 Metros 162.2% 117.0% 101.5% 82.0% 62.5% 35.0% 29.4% 26.7% 24.6% 21.5% Source: U.S. Bureau of Labor Statistics
Percent of jobs recovered through Aug ’12Houston vs. Second 10 Metros 162.2% 55.1% 61.4% 55.0% 43.1% 43.5% 34.2% 31.6% 18.7% 23.1% 21.8% Source: U.S. Bureau of Labor Statistics
In the competition among U.S. metros for job creation? Houston has already won the super bowl.
So what makes Houston hot? Us Them
No Housing Bubble * Median-priced home divided by median household income for each metro area. Source: GHP calculations based on National Association of Homebuilders data
No Housing Bubble *Years of Income to Buy a Home, Q1/’06 Source: GHP calculations based on National Association of Homebuilders data
No Housing Bubble *Years of Income to Buy a Home, Q1/’00 vs ’06 Source: GHP calculations based on National Association of Homebuilders data
No Housing Bubble *Years of Income to Buy a Home, Q1/’06 vsQ2/’12 Source: GHP calculations based on National Association of Homebuilders data
No Housing Bubble No zoning = lower housing costs Market forces determine best use of resources
No Housing Bubble • “Large metro areas with the least restrictive zoning have housing cost gaps that are 40 to 63 percentage points lower than metro areas with the most exclusionary zoning.” • Housing Costs, Zoning, and Access to High Performing Schools, Brookings Institute, April 19, 2012
We found shale in our backyard Harris County
So where are we now? 8,400 corporate jobs added since May ’09 9,100 oil field service jobs added since Nov ’09 7,400 equipment manufacturing jobs added since Nov ’09
WTI Spot Price ($/bbl ) • Wednesday close • $90.26 • One year ago • $76.40 • Three years ago • $69.34 • Average over last fifty-two weeks • $95.02
Global Trade Ties Source: IHS Global Insight
Global Trade Ties $ Value, Billions, Houston-Galveston Customs District, Through August Source: U.S. Census Bureau
Data does not include trade in services 1,500 firms in Houston’s service sector doing business overseas
So where are we now? We’re cool . . .
So where are we now? We’re cool . . . . . . and we’re popular.
Houston’s Population Clock The region adds 110,000 residents each year. • 65,000 via natural increase • i.e., more births than deaths • 45,000 via net inmigration • i.e., more people moving in than out
Houston’s Population Clock Every 5.4 minutes a new Houstonian is born.
Houston’s Population Clock Every 15.7 minutes a Houstonian dies.