Download
1 / 30
310 likes | 428 Views
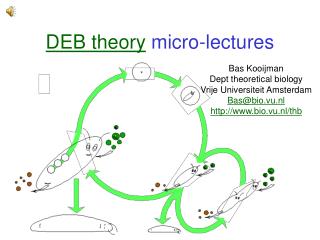
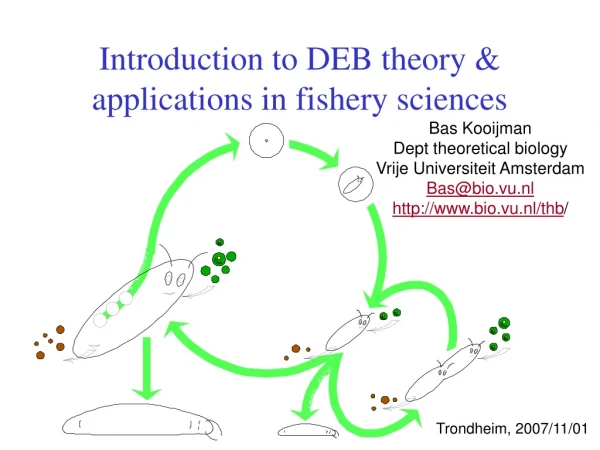
The application of DEB theory to fish energetics. Bas Kooijman Dept theoretical biology Vrije Universiteit Amsterdam Bas@bio.vu.nl http://www.bio.vu.nl/thb. S ète , 2005/01/12. Contents. DEB theory introduction Allocation & growth Body parts Scaling Schooling.

E N D
The application of DEB theory to fish energetics Bas Kooijman Dept theoretical biology Vrije Universiteit Amsterdam Bas@bio.vu.nl http://www.bio.vu.nl/thb Sète, 2005/01/12
Contents • DEB theory • introduction • Allocation & growth • Body parts • Scaling • Schooling Sète, 2005/01/12
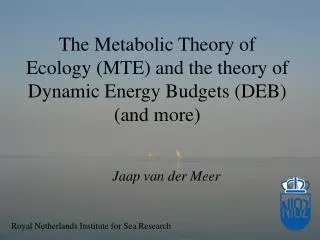
Dynamic Energy Budget theoryfor metabolic organisation • Uptake of substrates (nutrients, light, food) • by organisms and their use (maintenance, growth, • development, reproduction) • First principles, quantitative, axiomatic set up • Aim: Biological equivalent of Theoretical Physics • Primary target: the individual with consequences for • sub-organismal organization • supra-organismal organization • Relationships between levels of organisation • Many popular empirical models are special cases of DEB
Space-time scales Each process has its characteristic domain of space-time scales system earth space ecosystem population When changing the space-time scale, new processes will become important other will become less important Individuals are special because of straightforward energy/mass balances individual cell time molecule
DEB theory is axiomatic, based on mechanisms not meant to glue empirical models Since many empirical models turn out to be special cases of DEB theory the data behind these models support DEB theory This makes DEB theory very well tested against data Empirical special cases of DEB
Not age, but size: :These gouramis are from the same nest, they have the same age and lived in the same tankSocial interaction during feeding caused the huge size differenceAge-based models for growth are bound to fail; growth depends on food intake Trichopsis vittatus
Some DEB pillars • life cycle perspective of individual as primary target • embryo, juvenile, adult (levels in metabolic organization) • life as coupled chemical transformations (reserve & structure) • time, energy & mass balances • surface area/ volume relationships (spatial structure & transport) • homeostasis (stoichiometric constraints via Synthesizing Units) • syntrophy (basis for symbioses, evolutionary perspective) • intensive/extensive parameters: body size scaling
Biomass: reserve(s) + structure(s) • Reserve(s), structure(s): generalized compounds, • mixtures of proteins, lipids, carbohydrates: fixed composition • Compounds in • reserve(s): equal turnover times, no maintenance costs • structure: unequal turnover times, maintenance costs • Reasons to delineate reserve, distinct from structure • metabolic memory • explanation of respiration patterns (freshly laid eggs don’t respire) • biomass composition depends on growth rate • fluxes are linear sums of assimilation, dissipation and growth • basis of method of indirect calorimetry • explanation of inter-species body size scaling relationships
defecation feeding food faeces assimilation reserve somatic maintenance maturity maintenance 1- maturation reproduction growth maturity offspring structure Basic DEB scheme
-rule for allocation Ingestion Respiration Ingestion rate, 105 cells/h O2 consumption, g/h Length, mm Length, mm Length, mm Reproduction Cum # of young • 80% of adult budget • to reproduction in daphnids • puberty at 2.5 mm • No change in • ingest., resp., or growth • Where do resources for • reprod come from? Or: • What is fate of resources • in juveniles? Growth: Von Bertalanffy Age, d Age, d
Embryonic development Carettochelys insculpta Data from Web et al 1986 embryo yolk O2 consumption, ml/h weight, g time, d time, d : scaled time l : scaled length e: scaled reserve density g: energy investment ratio ;
Embryonic development Salmo trutta Data from Gray 1926 yolk embryo weight, g time, d
Growth at constant food length, mm Von Bert growth rate -1, d time, d ultimate length, mm Von Bertalanffy growth curve: time Length L. at birth ultimate L. von Bert growth rate energy conductance maint. rate coefficient shape coefficient
Von Bertalanffy growth Length, mm Data from Greve, 1972 Arrhenius Age, d
Competitive tumour growth Allocation to tumour relative maint workload defecation feeding food faeces assimilation Isomorphy: is constant Tumour tissue: low spec growth costs low spec maint costs reserve somatic maintenance maturity maintenance 1- maint maturation reproduction u 1-u growth maturity offspring Van Leeuwen et al., 2003 The embedded tumour: host physiology is important for the evaluation of tumour growth. British J Cancer 89, 2254-2268 structure tumour
Competitive organ growth fraction of catabolic flux Allocation to velum vs gut relative workload Macoma low food Macoma high food Collaboration: Katja Philipart (NIOZ)
Change in body shape Isomorph: surface area volume2/3 volumetric length = volume1/3 Mucor Ceratium Merismopedia V0-morph: surface area volume0 V1-morph: surface area volume1
Mixtures of V0 & V1 morphs volume, m3 hyphal length, mm Bacillus = 0.2 Collins & Richmond 1962 Fusarium = 0 Trinci 1990 time, min time, h volume, m3 volume, m3 Escherichia = 0.28 Kubitschek 1990 Streptococcus = 0.6 Mitchison 1961 time, min time, min
Reproduction Definition: Conversion of adult reserve(s) into embryonic reserve(s) Energy to fuel conversion is extracted from reserve(s) Implies: products associated with reproduction (e.g. CO2, NH3) Allocation to reproduction in adults: Allocation per time increment is infinitesimally small We therefore need a buffer with buffer-handling rules for egg prod (no buffer required in case of placental mode) Strong homeostasis: Fixed conversion efficiency Weak homeostasis: Reserve density at birth equals that of mother Reproduction rate: follows from maintenance + growth costs, given amounts of structure and reserve at birth
Reproduction at constant food 103 eggs 103 eggs Rana esculenta Data Günther, 1990 Gobius paganellus Data Miller, 1961 length, mm length, mm
{pAm}/{pXm} = 0.2 [pM] = 225 W m-3 [EG] = 7 kJ cm-3 [Em] 2.5 kJ cm-3 Application to flatfish
Inter-species body size scaling • parameter values tend to co-vary across species • parameters are either intensive or extensive • ratios of extensive parameters are intensive • maximum body length is • allocation fraction to growth + maint. (intensive) • volume-specific maintenance power (intensive) • surface area-specific assimilation power (extensive) • conclusion : (so are all extensive parameters) • write physiological property as function of parameters • (including maximum body weight) • evaluate this property as function of max body weight Kooijman 1986 Energy budgets can explain body size scaling relations J. Theor. Biol.121: 269-282
Body weight Body weight has contribution from structure and reserve If reserves allocated to reproduction hardly contribute: intra-spec body weight inter-spec body weight intra-spec structural volume Inter-spec structural volume reserve energy compound length-parameter specific density for structure molecular weight for reserve chemical potential of reserve maximum reserve energy density
Metabolic rate • Usually quantified in three different ways • consumption of dioxygen • production of carbon dioxide • dissipation of heat • DEB theory: These fluxes are weighted sums of • assimilation • maintenance • growth • Weight coefficients might differ • Not constant, depends on size & feeding conditions
Scaling of metabolic rate Respiration: contributions from growth and maintenance Weight: contributions from structure and reserve Structure ; = length; endotherms
Metabolic rate slope = 1 Log metabolic rate, w O2 consumption, l/h 2 curves fitted: endotherms 0.0226 L2 + 0.0185 L3 0.0516 L2.44 ectotherms slope = 2/3 unicellulars Log weight, g Length, cm Intra-species Inter-species (Daphnia pulex)
Lp, cm L, cm Length at puberty Clupoid fishes Sardinella + Engraulis * Centengraulis Stolephorus Clupea • Brevoortia ° Sprattus Sardinops Sardina Data from Blaxter & Hunter 1982 Length at first reproduction Lp ultimate lengthL
Spatial structure: schooling Scomber scombrus Isomorphic schools: Number of feeding individuals N 2/3 Feeding rate per individual N -1/3 Population models require rules for birth and death of schools; shools are just “super individuals”
DEB tele-course 2005 Feb – April 2005, 10 weeks, 200 h no financial costs http://www.bio.vu.nl/thb/deb/course/deb/ Vacanciesat Dept Theor Biol VUA EU-projects Modelkey (1PhD+1PD), Nomiracle (1PhD) see http://www.bio.vu.nl/thb/ Download slides of Sète lecture by Bas Kooijman http://www.bio.vu.nl/thb/users/bas/lectures/