Download
1 / 30
300 likes | 307 Views
Introduction to DEB theory & applications in fishery sciences. Bas Kooijman Dept theoretical biology Vrije Universiteit Amsterdam Bas@bio.vu.nl http://www.bio.vu.nl/thb /. Trondheim, 2007/11/01. Introduction to DEB theory & applications in fishery sciences. Bas Kooijman

E N D
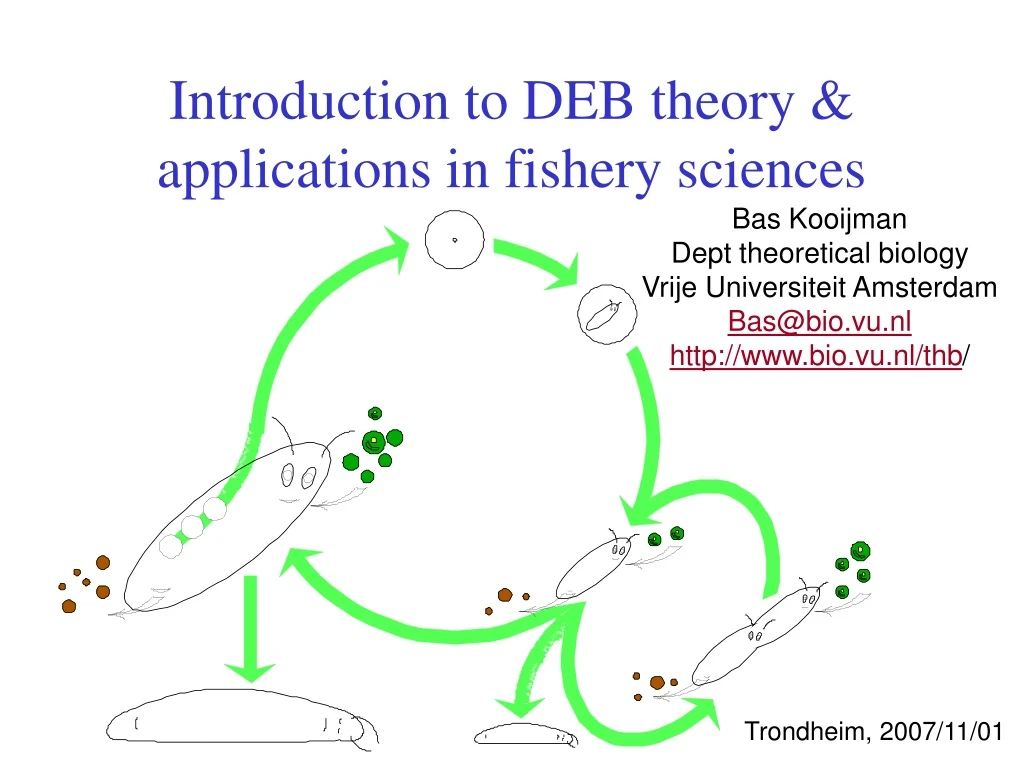
Introduction to DEB theory & applications in fishery sciences Bas Kooijman Dept theoretical biology Vrije Universiteit Amsterdam Bas@bio.vu.nl http://www.bio.vu.nl/thb/ Trondheim, 2007/11/01
Introduction to DEB theory & applications in fishery sciences Bas Kooijman Dept theoretical biology Vrije Universiteit Amsterdam Bas@bio.vu.nl http://www.bio.vu.nl/thb/ • Contents: • What is DEB theory? • Evolution & homeostasis • Standard model & calorimetry • Product formation • Allocation • Unexpected links • Social behaviour • Reconstruction • Body size scaling Trondheim, 2007/11/01
Dynamic Energy Budget theory for metabolic organization • consists of a set of consistent and coherent assumptions • uses framework of general systems theory • links levels of organization • scales in space and time: scale separation • quantitative; first principles only • equivalent of theoretical physics • interplay between biology, mathematics, • physics, chemistry, earth system sciences • fundamental to biology; many practical applications
Research strategy 1)use general physical-chemical principles to develop an educated quantitative expectation for the eco-physiological behaviour of a generalized species 2) estimate parameters for any specific case compare the values with expectations from scaling relationships deviations reveal specific evolutionary adaptations 3) study deviations from model expectations learn about the physical-chemical details that matter in this case but had to be ignored because they not always apply Deviations from a detailed generalized expectation provide access to species-specific (or case-specific) modifications
DEB theory is axiomatic, based on mechanisms not meant to glue empirical models Since many empirical models turn out to be special cases of DEB theory the data behind these models support DEB theory This makes DEB theory very well tested against data DEB theory reveals when to expect deviations from these empirical models Empirical special cases of DEB
Individual Ecosystem • population dynamics is derived from • properties of individuals + interactions between them • evolution according to Darwin: • variation between individuals + selection • material and energy balances: • most easy for individuals • individuals are the survival machines of life
3 4 5 1 2 prokaryotes 7 plants 9 animals 6 8 Evolution of DEB systems variable structure composition strong homeostasis for structure increase of maintenance costs delay of use of internal substrates inernalization of maintenance installation of maturation program strong homeostasis for reserve Kooijman & Troost 2007 Biol Rev, 82, 1-30 reproduction juvenile embryo + adult specialization of structure
Homeostasis strong homeostasis constant composition of pools (reserves/structures) generalized compounds, stoichiometric contraints on synthesis weak homeostasis constant composition of biomass during growth in constant environments determines reserve dynamics (in combination with strong homeostasis) structural homeostasis constant relative proportions during growth in constant environments isomorphy .work load allocation ectothermy homeothermy endothermy supply demand systems development of sensors, behavioural adaptations
defecation feeding food faeces assimilation reserve somatic maintenance maturity maintenance 1- maturation reproduction growth maturity offspring structure Standard DEB model Definition of standard model: Isomorph with 1 reserve & 1 structure feeds on 1 type of food has 3 life stages (embryo, juvenile, adult) • Extensions of standard model: • more types of • food and food qualities • reserve (autotrophs) • structure (organs, plants) • changes in morphology • different number of life stages
assimilation: substrate reserve + products linked to surface area dissipation: reserve products somatic maintenance: linked to surface area & structural volume maturity maintenance: linked to maturity maturation or reproduction overheads growth: reserve structure + products Product formation = A assimilation + B dissipation + C growth Examples: heat, CO2, H2O, O2, NH3 Indirect calorimetry: heat = D O2-flux + E CO2-flux + F NH3-flux Three basic fluxes
Product Formation According to Dynamic Energy Budget theory: Product formation rate = wA. Assimilation rate + wM. Maintenance rate + wG . Growth rate For pyruvate: wG<0 ethanol pyruvate, mg/l pyruvate glycerol, ethanol, g/l glycerol throughput rate, h-1 Glucose-limited growth of Saccharomyces Data from Schatzmann, 1975
Static Mixtures of V0 & V1 morphs volume, m3 hyphal length, mm Bacillus = 0.2 Collins & Richmond 1962 Fusarium = 0 Trinci 1990 time, min time, h volume, m3 volume, m3 Escherichia = 0.28 Kubitschek 1990 Streptococcus = 0.6 Mitchison 1961 time, min time, min
-rule for allocation Ingestion Respiration Ingestion rate, 105 cells/h O2 consumption, g/h Length, mm Length, mm Length, mm Reproduction Cum # of young • large part of adult budget • to reproduction in daphnids • puberty at 2.5 mm • No change in • ingest., resp., or growth • Where do resources for • reprod. come from? Or: • What is fate of resources • in juveniles? Growth: Von Bertalanffy Age, d Age, d
Size of body parts Static generalization of -rule whole body heart weight, g time, d time, d Data: Gille & Salomon 1994 on mallard
Tumour growth Dynamic generalization of -rule Allocation to tumour relative maint workload defecation feeding food faeces assimilation Isomorphy: [pMU] = [pM] Tumour tissue: low spec growth & maint costs Growth curve of tumour depends on pars no maximum size is assumed a priori Model explains dramatic tumour-mediated weight loss If tumour induction occurs late, tumours grow slower Caloric restriction reduces tumour growth but the effect fades reserve somatic maintenance maturity maintenance 1- maint maturation reproduction u 1-u growth maturity offspring structure tumour Van Leeuwen et al., 2003 British J Cancer 89, 2254-2268
Organ growth fraction of catabolic flux Allocation to velum vs gut relative workload Macoma low food Macoma high food Relative organ size is weakly homeostatic Collaboration: Katja Philipart (NIOZ)
Organ size & function Kidney removes N-waste from body At constant food availability JN = aL2 + bL3 Strict isomorphy: kidney size L3 If kidney function kidney size: work load reduces with size If kidney function L2 + cL3 for length L of kidney or body work load can be constant for appropriate weight coefficients This translates into a morphological design constraint for kidneys
Initial amount of reserve Initial amount of reserve E0 follows from • initial structural volume is negligibly small • initial maturity is negligibly small • maturity at birth is given • reserve density at birth equals that of mother at egg formation Accounts for • maturity maintenance costs • somatic maintenance costs • cost for structure • allocation fraction to somatic maintenance + growth Mean reproduction rate (number of offspring per time): R = (1-R) JER/E0 Reproduction buffer: buffer handling rules; clutch size
Embryonic development Crocodylus johnstoni, Data from Whitehead 1987 embryo yolk O2 consumption, ml/h weight, g time, d time, d : scaled time l : scaled length e: scaled reserve density g: energy investment ratio ;
DEB theory reveals unexpected links Streptococcus O2 consumption, μl/h 1/yield, mmol glucose/ mg cells Daphnia 1/spec growth rate, 1/h Length, mm respiration length in individual animals & yield growth in pop of prokaryotes have a lot in common, as revealed by DEB theory Reserve plays an important role in both relationships, but you need DEB theory to see why and how
Not age, but size: :These gouramis are from the same nest, they have the same age and lived in the same tankSocial interaction during feeding caused the huge size differenceAge-based models for growth are bound to fail; growth depends on food intake Trichopsis vittatus
Rules for feeding R1 a new food particle appears at a random site within the cube at the moment one of the resident particles disappears. The particle stays on this site till it disappears; the particle density X remains constant. R2 a food particle disappears at a constant probability rate, or because it is eaten by the individual(s). R3 the individual of length L travels in a straight line to the nearest visible food particle at speed X2/3 L2, eats the particle upon arrival and waits at this site for a time th = {JXm}-1 L-2. Direction changes if the aimed food particle disappears or a nearer new one appears. Speed changes because of changes in length. R4 If an individual of length L feeds: scaled reserve density jumps: e e + (LX/ L)3 Change of scaled reserve density e: d/dt e = - e {JXm} LX3/ L; Change of length L: 3 d/dt L = ({JXm} LX3 e - L kM g) (e + g)-1 At time t = 0: length L = Lb,; reserve density e = f. R5 a food particle becomes invisible for an individual of length L1, if an individual of length L1 is within a distance Ls (L2/ L1)2 from the food particle, irrespective of being aimed at.
Social interaction Feeding 2.1.2 determin expectation length reserve density 1 ind time time 2 ind length reserve density time time
Otolith growth & opacity • standard DEB model: otolith is a product • otolith growth has contributions from • growth & dissipation • (= maintenance + maturation + reprod overheads) • opacity relative contribution from growth • DEB theory allows reconstruction • of functional response from opacity data • as long as reserve supports growth • Reconstruction is robust for deviations from • correct temperature trajectory Laure Pecquerie 2007: reading the otolith
Otolith opacity Functional response temp correction functional response time, d opacity time, d otolith length, m body length, cm otolith length, m reserve density time, d time, d time, d Laure Pecquerie 2007: reading the otolith
Primary scaling relationships assimilation {JEAm} max surface-specific assim rate Lm feeding {b} surface- specific searching rate digestion yEX yield of reserve on food growth yVEyield of structure on reserve mobilization v energy conductance heating,osmosis {JET} surface-specific somatic maint. costs turnover,activity [JEM] volume-specific somatic maint. costs regulation,defence kJ maturity maintenance rate coefficient allocation partitioning fraction egg formation R reproduction efficiency life cycle [MHb] volume-specific maturity at birth life cycle [MHp] volume-specific maturity at puberty aging ha aging acceleration Kooijman 1986 J. Theor. Biol. 121: 269-282 maximum length Lm = {JEAm} / [JEM]
Scaling of metabolic rate 8.2.2 Respiration: contributions from growth and maintenance Weight: contributions from structure and reserve Structure ; = length; endotherms
Metabolic rate slope = 1 Log metabolic rate, w O2 consumption, l/h 2 curves fitted: endotherms 0.0226 L2 + 0.0185 L3 0.0516 L2.44 ectotherms slope = 2/3 unicellulars Log weight, g Length, cm Intra-species Inter-species (Daphnia pulex)
Von Bertalanffy growth rate 8.2.2 25 °C TA = 7 kK 10log von Bert growth rate, a-1 10log ultimate length, mm 10log ultimate length, mm At 25 °C : maint rate coeff kM = 400 a-1 energy conductance v = 0.3 m a-1 ↑ ↑ 0
DEB tele course 2009 http://www.bio.vu.nl/thb/deb/ Free of financial costs; some 250 h effort investment Program for 2009: Feb/Mar general theory April symposium in Brest (2-3 d) Sept/Oct case studies & applications Target audience: PhD students We encourage participation in groups that organize local meetings weekly Software package DEBtool for Octave/ Matlab freely downloadable Slides of this presentation are downloadable from http://www.bio.vu.nl/thb/users/bas/lectures/ Cambridge Univ Press 2000 Audience: thank you for your attention Organizers: thank you for the invitation Vacancy PhD-position on DEB theory http://www.bio.vu.nl/thb/