Download
1 / 24
240 likes | 371 Views
Comparison of Measured and Modeled Snow Brightness Temperature Using Various Field Techniques for Grain Size Measurement. Edward KIM NASA Goddard Space Flight Center Michael DURAND Ohio State University Noah MOLOTCH University of Colorado, Boulder

E N D
Comparison of Measured and Modeled Snow Brightness Temperature Using Various Field Techniques for Grain Size Measurement Edward KIM NASA Goddard Space Flight Center Michael DURAND Ohio State University Noah MOLOTCH University of Colorado, Boulder Daniel F. BERISFORD Jet Propulsion Laboratory Steven MARGULIS University of California Los Angeles Zoe COURVILLE Cold Regions Research and Engineering Laboratory
Outline • Problem statement • Our approach • Description of snow field measurements • EM models • Microwave radiometer • Tb comparison results • Summary & Conclusions
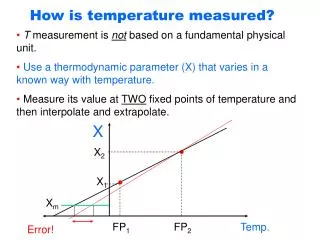
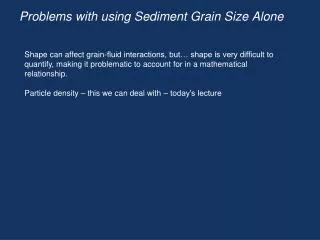
The Problem with Snow Remote Sensing and “Grain Size” • For microwave remote sensing of snow, accurate grain size numbers are extremely important to have because… • the microwave signature of snow is highly sensitive to grain size • Unfortunately “grain size” is not easy to quantify accurately, especially in the field • So what is the “best” way to measure grain size in the field for use in microwave snow emission models?
How to determine a “best” grain size field measurement technique? • What do we really need? • What do we already have? • How do we compare (and will anyone else believe our results)? • What are we going to use as “truth”? • What is practical?
Our Approach • Field Measurements • Small campaign: 6 days, 1 snow pit per day • Limited set of techniques; side-by-side • Stereology chosen as “truth” • Location: Storm Peak Lab, Steamboat, Colorado, USA • Brightness Temperature Comparison • Try 2 EM models, both multi-layer • Grain size & stratigraphy info fed into EM models • Models output brightness temperatures (Tb) • Compare model Tb vs. observed Tb
Grain Size Measurement Techniques • Hand lens • NIR photography • Spectroscopy • Contact • New probe • Stereology
Hand lens grain size measurements Pit A Pit B • Plenty of precedent (e.g., CLPX) • Non-repeatable (e.g., two pits one meter apart; different days, plus user variations; ‘B’ pit was in the radiometer FOV) Pex & Dmax related as in Durand, Kim, Margulis, 2008
NIR Camera grain size • Repeatable (in theory) • Empirically-based (transferability?) 1m Pack Depth ~1m Matzl and Schneebeli, 2006 Mätzler, 2002
Contact Spectroscopy • Measures reflectance across entire VIS/IR range • Reflectance varies with grain size (see plot at right) • Vertical resolution ~2cm • Requires commercial spectrometer ($$) • Requires dark tarp to block unwanted background light
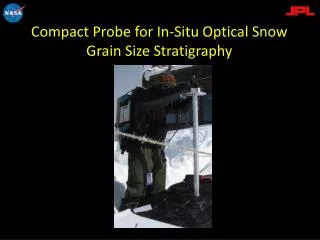
Spectral Profiler Probe Prototype • Sends an optical package into a slotted sleeve inserted into the snowpack to perform contact spectroscopy in-situ, w/o snowpit. • Black tarp not shown to block light at base.
drive tube Spectral Profiler Probe fiber optic to spectrometer • Send optics down hole • Lateral reflectance spectra • Fiber optic sends signal to spectrometer on surface • No snowpit needed! • Prototype unit; 1st field trial, so analysis still in progress probe carrier body optical camera spectral reflectance probe aluminum sleeve nylon brush
Stereology grain size (1/4) • 3D cast of actual snow grain structure made with dimethyl phthalate • Frozen in field with dry ice (stop metamorphism) • Shipped to CRREL for processing in cold room • Relatively well-known technique, but logistically intensive Perla & Davis, 1980’s & earlier references Matzl and Schneebeli, 2010
Stereology grain size (2/4) Red line = 1mm Time consuming laboratory work to cut and photograph: 20 slices / sample
Stereology grain size (3/4) • Cycloids overlaid on image for estimating surface area • Time-consuming manual counting work • Yields SSA directly, but then need to convert to pex for MEMLS L=total length of cycloid lines I=# of intersections crossed v=ice volume fraction Do= optical equiv. grain size Red line = 1mm Matzl and Schneebeli, 2010
Stereology grain size (4/4) • Image is classified as air or ice • Draw line through image, compute autocorrelation, do for each vertical line • Exponential is fit to true autocorrelation function Wiesmann et al., 1998
EM models • MEMLS • Multi-layer HUT
MEMLS sensitivity of Tb to grain size • Vertically averaged optical equivalent grain size from pit • Run MEMLS • Sensitivity is the tangent to the curve • For this grain size (vertical line), sensitivity is similar for 19 & 37 GHz • To achieve 5K Tb accuracy, need 10% grain size accuracy, so for typical grain size, this means
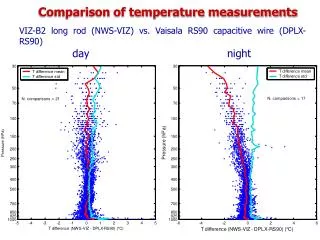
Radiometric measurements • Brightness measured daily for three days at 19 and 37 GHz, v-pol
Results & Discussion • Grain size & stratigraphy info fed into EM models • Models output brightness temperatures (Tb) • Compare model Tb vs. observed Tb
MEMLS (pex) vs. observations • Bias and mean absolute error < 5 K • No empirical tuning factors required! • Based on laboratory work
Multi-layer HUT results • 19v observed: 249 K • 19v modeled: 230 K (similar for SPL5 and SPL6) • 37v observed: 230 K • 37v modeled: 153 K (similar for SPL5 and SPL6) • The 19v is off by 20 K, and the 37v is off by 80 K. Averaged together, and you have 50 K.
Multi-layer HUT results • Note: HUT is set up to use hand lens Dmax measurements, so we’ve compared that to MEMLS hand lens, and then to MEMLS stereology as a reference
Summary & Conclusions • Used hand lens, spectroscopy, NIR, & stereology methods to measure grain size; stereology was our ‘truth’ • Used the grain size/correlation length to drive EM models (MEMLS, multi-layer HUT) • Compared EM model Tb’s vs. observed Tb’s (‘truth’) • Using lab-based methods, Tb errors are 5-8 K • Using field-based methods, Tb errors are ~10 K • For error <=5K, need grain size accurate to ~10% ==> 20-100um • Using pex directly from stereology, no tuning empirical factor is required • Using SSA, an empirical factor (0.74) is required to get the right Tb – attested to in literature (Mätzler, 2002) • Need further examination of multi-layer HUT to understand apparent cold bias