Download
1 / 47
470 likes | 603 Views
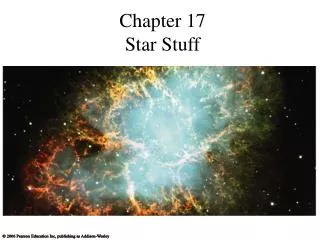
Ohio University - Lancaster Campus slide 1 of 47 Spring 2009 PSC 100. A star’s color, temperature, size, brightness and distance are all related!. Ohio University - Lancaster Campus slide 2 of 47 Spring 2009 PSC 100. The Beginnings.

E N D
Ohio University - Lancaster Campus slide 1 of 47Spring 2009 PSC 100 A star’s color, temperature, size, brightness and distance are all related!
Ohio University - Lancaster Campus slide 2 of 47Spring 2009 PSC 100 The Beginnings • Late 1800’s, early 1900’s – how light is produced by atoms is being intensely studied by… • Gustav Kirchoff & Robert Bunsen • Max Planck…Josef Stefan... • Ludwig Boltzmann…Albert Einstein
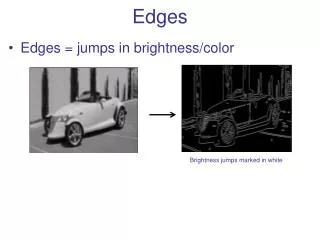
Ohio University - Lancaster Campus slide 3 of 47Spring 2009 PSC 100 Black Bodies • In 1862, Kirchoff coins the phrase “black body” to describe an imaginary object that would perfectly absorb any light (of any wavelength) that hit it. • No light transmitted through, no light reflected off, just totally absorbed.
Ohio University - Lancaster Campus slide 4 of 47Spring 2009 PSC 100 • a perfect absorber of light would also be a perfect emitter • amount of light energy given off each second (its brightness or luminosity) and the color of its light are related to the object’s temperature.
Ohio University - Lancaster Campus slide 5 of 47Spring 2009 PSC 100 • Molten lava and hot iron are two good examples of black bodies, but… • a star is an excellent black body emitter.
Ohio University - Lancaster Campus slide 6 of 47Spring 2009 PSC 100 • Max Planck, a German physicist, was able to make theoretical predictions of how much light of each color or wavelength would be given off by a perfect black body at any given temperature. • These predictions or models are today called Planck Curves.
Ohio University - Lancaster CampusSpring 2009 PSC 100 slide 7 of 47
Ohio University - Lancaster Campus slide 8 of 47Spring 2009 PSC 100 • What 2 characteristics of the curves change as the temperature increases? • The size of the curve increases. (2) The peak of the curves shift to theleft, to shorter wavelengths & higher energies.
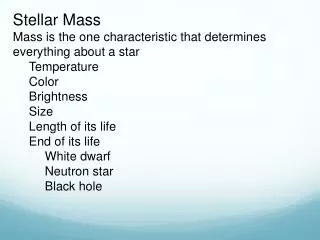
Ohio University - Lancaster Campus slide 9 of 47Spring 2009 PSC 100 Can we draw some conclusions? • Hotter stars should be brighter than cooler stars. • Hotter stars should emit more of their light at shorter wavelengths (bluer light) • Cooler stars should emit more of their light at longer wavelengths (redder light). • All stars emit some energy at all wavelengths!
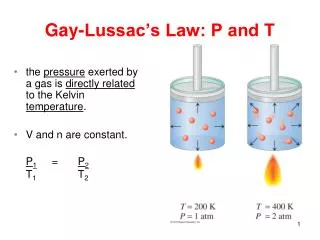
Ohio University - Lancaster Campus slide 10 of 47Spring 2009 PSC 100 • In 1879, Josef Stefan discovered that the luminosity of a star was proportional to the temperature raised to the 4th power. • In 1884, Stefan’s observations were confirmed when Ludwig Boltzmann derived Stefan’s equation from simpler thermodynamic equations.
Ohio University - Lancaster Campus slide 11 of 47Spring 2009 PSC 100 Stefan-Boltzmann Law • Today, we honor both scientists by naming the equation after them…the Stefan-Boltzmann Law: • At the surface of the star, the energy that’s given off per square meter (Watts / m2) called the luminous flux is... W / m2 = 5.67 x 10⁻⁸ T4
Ohio University - Lancaster Campus slide 12 of 47Spring 2009 PSC 100 • At 100 K (cold enough to freeze you solid in just seconds), a black body would emit only 5.67 W/m2. • At 10x hotter, 1000 K, the same black body would emit 104 times as much light energy, or 56,700 W/m2.
Ohio University - Lancaster Campus slide 13 of 47Spring 2009 PSC 100 • If the temperature of a star were to suddenly double, how much brighter would the star become? • If the temperature of a star somehow fell to 1/3 of what it was, how much fainter would the star become? 24 = 16 times brighter(1/3)4 = 1/81, or 81 times dimmer
Ohio University - Lancaster Campus slide 14 of 47Spring 2009 PSC 100 • In 1893, Wilhelm Wien (pronounce “vine”) discovered by experiment the relationship between the “main” color of light given off by a hot object and its temperature. • This “main” color is the peak wavelength, called λmax , at the top of the Planck Curve.
For each curve, the top of the curve is the peak wavelength.
Ohio University - Lancaster Campus slide 16 of 47Spring 2009 PSC 100 Wien’s Law • Wien’s Law says that the peak wavelength is proportional to the inverse of the temperature: λmax = 2.9 x 10⁶ T = 2.9 x 10⁶ T λmax • T must be in Kelvin, and λmax in nanometers.
Ohio University - Lancaster Campus slide 17 of 47Spring 2009 PSC 100 • What is the peak wavelength of our sun, with a T = 5750 K? • What is the peak wavelength of a star with a surface temperature of 3500 K? 2.9 x 106 = 504 nm (yellowish-green) 5750 K 2.9 x 106 = 829 nm (this star emits the 3500 K majority of its light as infrared, IR).
Ohio University - Lancaster Campus slide 18 of 47Spring 2009 PSC 100 • A reddish star has a peak wavelength of 650 nm. What is the star’s temperature? A star has a peak wavelength in the ultra-violet of 300 nm. What is the star’s temperature? 2.9 x 106 = 4462 K (cooler than the sun) 650 nm 2.9 x 106 = 9667 K 300 nm
Ohio University - Lancaster Campus slide 19 of 47Spring 2009 PSC 100 • We now have a “color thermometer” that we can use to determine the temperature of any astronomical object, just by examining the light the object gives off. • We know that different classes of objects are at different temperatures and give off different peak wavelengths.
Clouds of cold hydrogen gas (nebulae) emit radio waves What kinds of objects? http://www.narrowbandimaging.com/images/vdb142_small.jpg
Warmer clouds of molecules where stars form emit microwaves and IR.
Protostars emit IR. http://www.antonine-education.co.uk/Physics_GCSE/Unit_3/Topic_10/protostar.jpg
Sun-like stars emit mostly visible light, while hotter stars peak in the UV. http://www.nasa.gov/images/content/138952main_whywe16full.jpg
Star cores emit gamma rays. http://aspire.cosmic-ray.org/labs/star_life/images/star_pic.jpg
Ohio University - Lancaster Campus slide 26 of 47Spring 2009 PSC 100 • Where would the peak wavelength be for • your body • a lightning bolt • the coals from a campfire
Ohio University - Lancaster Campus slide 27 of 47Spring 2009 PSC 100 • A star’s spectrum is also influenced by • its temperature. • In 1872, Henry Draper obtained the first • spectrum of a star, Vega, in the • constellation Lyra. photojournal.jpl.nasa.gov/jpeg/PIA04204.jpg Credit: Lick Observatory Archives
Ohio University - Lancaster Campus slide 28 of 47Spring 2009 PSC 100 • In 1885, Edward Pickering began a project at Harvard University to determine the • spectra of many stars. Draper’s widow • funded the work. • The first 10,000 spectra obtained were • classified by Williamnia Fleming, using the • letters A through Q.
Ohio University - Lancaster Campus slide 29 of 47Spring 2009 PSC 100 • From 1901 to 1919, Pickering & his assistant • Annie Jump Cannon classified and published • the spectra of 225,000 stars (at the rate of • about 5000 per month!) • When Pickering died in 1919, Cannon • continued the work, eventually classifying • and publishing the spectra of 275,000 stars. Credit: amazing-space.stsci.edu
Ohio University - Lancaster Campus slide 30 of 47Spring 2009 PSC 100 Hotter stars have simpler spectra. Cooler stars have more complex spectra, since most atoms are not ionized.
Ohio University - Lancaster Campus slide 31 of 47Spring 2009 PSC 100 • Class O >30,000 K bluish • He lines in spectrum. • (These stars are so hot that H is mostly ionized & doesn’t shows lines.) Pleiades • Class B 11,000-30,000 K bluish • He lines, weaker H lines • Rigel, Regulus, Spica • Class A 8,000-11,000 K blue-white H lines (Balmer Series) • Sirius, Vega
Ohio University - Lancaster Campus slide 32 of 47Spring 2009 PSC 100 • Class F 6,000-8,000 K white • H, Ca lines, weaker H lines Procyon • Class G 5,000-6,000 K yellow • Ca, Na lines, + other metals • Sun, Capella, -Centauri • Class K 3,500-5,000 K orange • Ca & other metals • Arcturus, Aldebaran
Ohio University - Lancaster Campus slide 33 of 47Spring 2009 PSC 100 • Class M <3,500 K red • metal oxides (TiO2), molecules • Betelgeuse, Antares • Oh, Be AFine Girl, Kiss Me!
Ohio University - Lancaster Campus slide 34 of 47Spring 2009 PSC 100 The stellar classes (OBAFGKM) are further subdivided with a number 0 to 9 following the letter. Our sun, a G2 star, is slightly cooler than the F range. A G9 star would be just a bit warmer than the K range.
Ohio University - Lancaster Campus slide 35 of 47Spring 2009 PSC 100 • 1910-1913, Henry Russell, a professor at • Princeton, and Ejnar Hertzsprung, an • astronomer at Leiden Observatory in the • Netherlands, used the data from the Draper • catalog to plot the temperature of the stars • vs. their brightness or luminosity. • What kind of result would you expect, a • random scatter, or a pattern?
Ohio University - Lancaster Campus slide 37 of 47Spring 2009 PSC 100 Betelgeuse and Antares show on the diagram as being red stars, and red stars should be faint. Both stars are also hundreds of light years distant, so why do they appear so bright in our sky?
Ohio University - Lancaster Campus slide 38 of 47Spring 2009 PSC 100
Ohio University - Lancaster Campus slide 39 of 47Spring 2009 PSC 100
Ohio University - Lancaster Campus slide 40 of 47Spring 2009 PSC 100
‘Red’ ‘Red’ Red Dwarfs
Ohio University - Lancaster Campus slide 42 of 47Spring 2009 PSC 100 The H-R Diagram makes a lot more sense when you realize that the different regions don’t show different kinds of stars… …but stars at different stages of their lives.
Ohio University - Lancaster Campus slide 43 of 47Spring 2009 PSC 100 • Determining distance using the HR Diagram • From a star’s color-temperature, determine • its absolute magnitude (M). • Observe the star’s apparent magnitude (m) • through a telescope. • Use the distance modulus equation to • calculate the distance.
Ohio University - Lancaster Campus slide 44 of 47Spring 2009 PSC 100 How far away is an F1 star that has a surface temperature of 8000 K, if its apparent magnitude is +9.6?
Ohio University - Lancaster Campus slide 46 of 47Spring 2009 PSC 100 distance in parsecs = 10^[(9.6 - 3.0 +5) 5] = 10^[11.6 5] = 10^2.32 = 209 parsecs (or 681 light years)
Where might this method run into trouble? Red & Orange star come in 2 varieties: giants & dwarfs. The spectrum of the star must be used to determine if the star is large or small. The presence of what element(s) in higher than normal percentages might indicate that the star is a giant, not a dwarf?