Download
1 / 26
260 likes | 340 Views
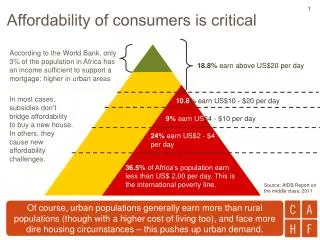
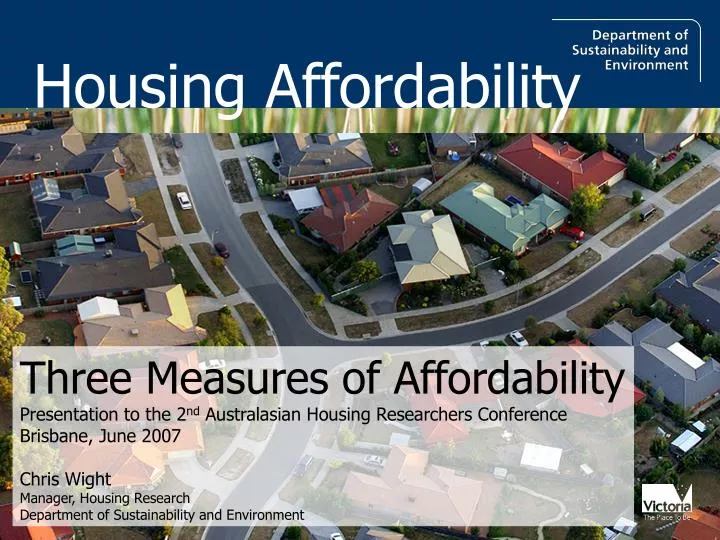
Three Measures of Affordability Presentation to the 2 nd Australasian Housing Researchers Conference Brisbane, June 2007 Chris Wight Manager, Housing Research Department of Sustainability and Environment. b. House Prices by suburb. Source: Valuer-General.

E N D
Three Measures of Affordability Presentation to the 2nd Australasian Housing Researchers Conference Brisbane, June 2007 Chris Wight Manager, Housing Research Department of Sustainability and Environment
b House Prices by suburb Source: Valuer-General
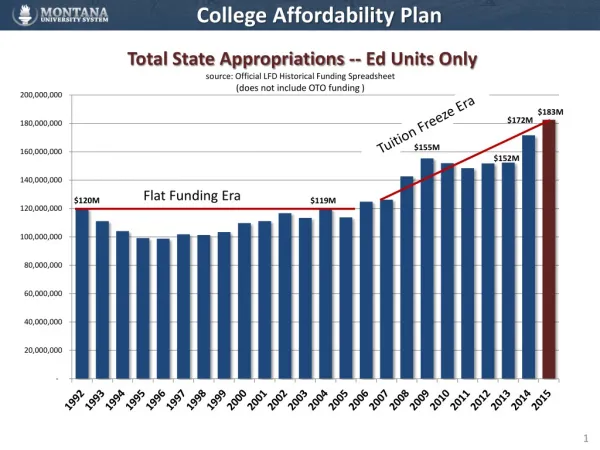
HIA Affordability index, 1984 - 2006 Source: HIA
HIA and DSE based on HIA formula indexes, 1990 - 2006 Source: HIA, Valuer-General, ABS, DSE
Development of the 3 measures • Joint project by the Office of Housing and DSE (OOH for private rental housing and DSE for housing purchases) • Swinburne University (Terry Burke) report to Department of Premier and Cabinet suggested a range of new/improved indicators that could be investigated. • The purpose of the joint project was to • develop the three new measures of Affordability and • test them – ie do they work? Are they useful and meaningful?
Three new indicators • Indicators cover both rental and purchases of housing • INDICATOR 1Income Ladder of Supply Affordability- number and percent of properties affordable at various income levels • INDICATOR 2Threshold Income- level of income necessary to afford housing in various locations • INDICATOR 3Supply Side Affordability- supply of dwellings within different price ranges
Three new indicators • Indicators use a standard formula • Rent: • 30% of household income spent on rental payments • Purchase • 30% of household income spent on mortgage repayments • 5% deposit for loan • ‘Current’ standard variable interest rate • All are available for • Metropolitan Melbourne, Regional Victoria, LGA, Suburb • Houses (incl. semi-detached), Flats/apartments • Income • Calculated from ABS Income and Housing Survey for Capital City/Rest of State and indexed for inflation (CPI)
Income Deciles • Based on ABS Income and Housing survey – modelled using CPI for years where data is not available Household income deciles, Melbourne and Regional Victoria, 2005/06 Source: data for 2000/01, 2002/03 & 2003/04 from ABS Income and Housing Survey. Data for 2001/02, 2004/05 and 2005/06 are estimates.
1. Income Ladder of Supply Affordability • Measure One indicated the number of dwellings that were for rented or sold: • That each household income decile could afford (10% of all households are in each decile – approx 1.9 million in Victoria) • In a given area (Melbourne, regional Victoria, LGA, Suburb) • For a given time period (years or financial years) • Number of houses for rent are based on those already rented • Number of houses for sale are based on those already sold • Good for showing the amount of stock available at specific income deciles and how that changes over time
1. Income Ladder of Supply Affordability Income Ladder of Supply Affordability (private rental) Metropolitan Melbourne (30% of Income) 100.0% 2000/01 2001/02 2002/03 2003/04 2004/05 90.0% 80.0% 70.0% 60.0% 50.0% 40.0% 30.0% 20.0% 10.0% 0.0% 10 20 30 40 50 60 70 80 90 Income Deciles Source: Office of Housing
1. Income Ladder of Supply Affordability Source: DSE
1. Income Ladder of Supply Affordability Source: DSE
1. Income Ladder of Supply Affordability Income Ladder of Supply Affordability (house purchase) Regional Victorian LGAs (4th Income Decile households, 30% of Income) Source: DSE
2. Threshold Income • Measure Two indicated the income required in a given area to afford dwellings (rents or purchase price). • Can show income require to rent/purchase different levels of stock: • Eg. 50th percentile (median) – ie half properties sold or rented for this amount • 25th percentile – ie 25% of properties sold or rented for this amount • And different levels of income • Good for comparing how much income would be required to get into specific suburbs or LGAs and how that changes over time.
2. Threshold Income House purchase market – 50th percentile (median) price Metropolitan Melbourne Household income required to purchase median house House Price Source: DSE
2. Threshold Income - Metropolitan Melbourne Source: DSE
2. Threshold Income House purchase market – 50th percentile (median) price Metropolitan Melbourne by LGA Median household income = $47,764 Median household income = $50,648 Source: DSE
3. Supply Side Affordability • Measure Three indicates the number of properties available for rent or purchase at specific price points. • Can show income require to rent/purchase different levels of stock: • Price points pre-determined but incomes indexed to fixed point in time • Good for showing change in available stock over time
3. Supply Side Affordability • Rental costs segments: • Purchase price segments: • $200,000 house requires mortgage repayments of 30% or 1.2 times median 2005/06 Melbourne household income ~ $51,000 p.a. • Median house price (VG) at June 2006 $340,000
3. Supply Side Affordability House purchase market supply by price segment - Melbourne 6 Source: DSE
3. Supply Side Affordability House purchase market supply by price segment – Regional Victoria 6 Source: DSE
3. Supply Side Affordability House purchase market supply by price segment – City of Frankston 06 Source: DSE
3. Supply Side Affordability House purchase market - selected Frankston suburbs 2005/06 Source: DSE
Features of Indicators • Based on unit records, so indicators are finer grained and can be aggregated at local levels • Analysis has strong spatial element – not restricted to simple ratio measures or metropolitan/regional geographies • Can be analysed at various levels of income and cost – not restricted to medians – can do individual or custom percentiles • Supply side better addressed – numbers & percentages of affordable housing analysed • Analysis so far looks at rents and purchases at Local Government Area and suburban level for houses and apartments (and can do vacant land).
What is still missing? • Income data is weak • Only presents a historical view – no indicator of pipeline, up coming supply • Generally supply related not demand • Doesn’t separate established stock from new • Doesn’t factor in other location-related costs eg transport (we are working on this)
Three Measures of Affordability Presentation to the 2nd Australasian Housing Researchers Conference Brisbane, June 2007 Chris Wight Manager, Housing Research Department of Sustainability and Environment