Download
1 / 22
220 likes | 320 Views
Roadmap Affordability Workgroup. ESD 113/Capital Event Center/Tumwater WA Agenda April 2, 2013 Introductions Review of information requested from previous meeting Aid types/sources over time Unmet need for lower income students over time

E N D
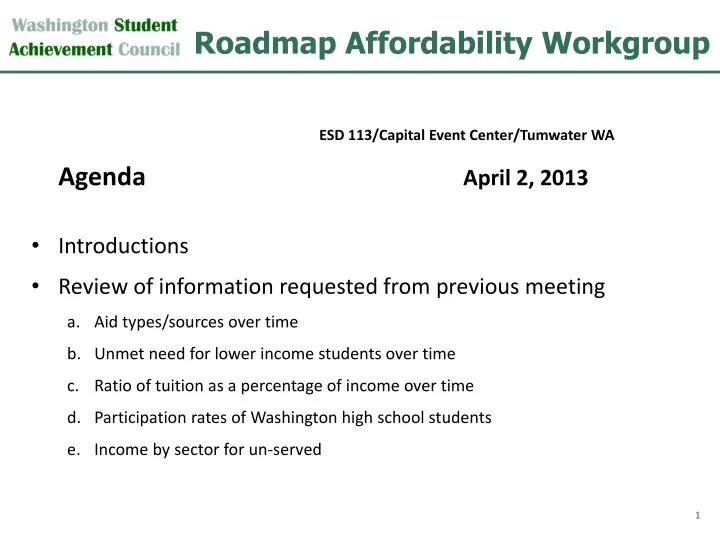
Roadmap Affordability Workgroup ESD 113/Capital Event Center/Tumwater WA Agenda April 2, 2013 • Introductions • Review of information requested from previous meeting • Aid types/sources over time • Unmet need for lower income students over time • Ratio of tuition as a percentage of income over time • Participation rates of Washington high school students • Income by sector for un-served
Agenda continued • Summary of approach to affordability section of Roadmap • Proposed guiding questions and approach to affordability • Should the council propose an estimated appropriate share of student and state share of cost? • Should the workgroup establish some premises upon which to base policy options? i. Washington is approaching becoming a “high tuition/high aid” state ii. Washington’s primary focus in financial aid has been to “level the playing field” for low-income students
Agenda continued c. Within the above framework, how can the current model of State Need Grant funding and delivery more efficiently address affordability? i. Targeting student eligibility – income threshold ii. Targeting student eligibility – incentives for success iii. Tying award amounts to public tuition iv. Coordination with other aid – “shared responsibility” approach
Unmet needs, excluding student loans, over the last four years
Unmet need patterns over the last four years • Are higher for the students in the lowest Median Family Income (MFI) group of 0 -70% MFI: • $9,925 (versus $8,841)in 2011-12 • If students borrowed $5,000 per year, their unmet need would be lowered to $4,925 in 2011-12 • Unmet need has increased for both groups: • 0-70% MFI unmet need has increased by $528 • 71% MFI and over unmet need has increased by $372
Unmet needs are also increasing for moderate-income students
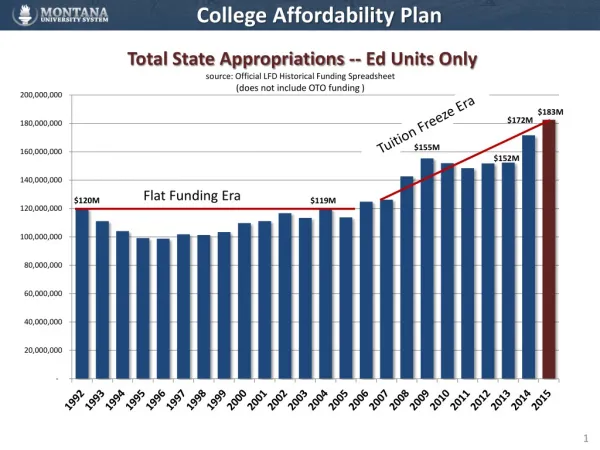
Increases in tuition & fees compared to WA MFI increases over 19 years MFI= WA Median Family Income for a Family of 4
Tuition & fees increasing faster than family incomes Median family incomes have increased by 95% over 19 years while tuition and fees have increased from 255% at CTCs to 355% at Public Research universities.
Students and families paying larger shares of tuition & fees
Tuition versus State shares Source: Washington Public Higher Education Financing Key Indicators and Trends Fiscal Years 2000 to 2013 Washington Student Achievement Council (Illustration 1 – page 5)
Un-served Eligible State Need Grant FTE Overall, 31% of eligible FTE are un-served. As a result of the distribution process, the portion of students by sector is the same for served and un-served students.
MFI distribution varies by sector • 87% of all served students are in the lowest income group (0-50 MFI). • Decreasing portions of the eligible MFI groups are served due to prioritization in awarding. • 72% of the 0-50 MFI eligible students are served, 59% of the 51-55 group, 55% of the 56-60 group, 50% of the 61-65 group and 43% of the 66-70 group • Students attending four-year campuses are more likely to be un-served if they are in upper MFI ranges.
Summary of approach to affordability section of Roadmap • Proposed guiding questions and approach to affordability • Should the council propose an estimated appropriate share of student and state share of cost? • Should the workgroup establish some premises upon which to base policy options? i. Washington is approaching becoming a “high tuition/high aid” state ii. Washington’s primary focus in financial aid has been to “level the playing field” for low-income students
c. Within the above framework, how can the current model of State Need Grant funding and delivery more efficiently address affordability? i. Targeting student eligibility – income threshold ii. Targeting student eligibility – incentives for success iii. Tying award amounts to public tuition iv. Coordination with other aid – “shared responsibility” approach
Next Steps • Next meeting April 16 • Discussionrelated to preparation and agenda