Download
1 / 36
360 likes | 458 Views
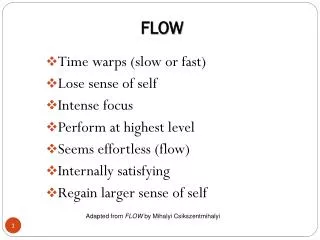
Northern Hemispheric flow Indices that may influence the Flow. Richard H. Grumm National Weather Service Office State College PA PSU 497A Lecture Series Version 3.0. Introduction. Large scale Indices that affect the flow and climatology over North America and Eurasia

E N D
Northern Hemispheric flow Indices that may influence the Flow Richard H. Grumm National Weather Service Office State College PA PSU 497A Lecture Series Version 3.0 NWS-State College
Introduction • Large scale Indices that affect the flow and climatology over North America and Eurasia • North Atlantic Oscillation (NAO) • Pacific Decadal Oscillation (PDO) • Pacific North American pattern (PNA) • East Pacific Index (EP) • Definitions • Impacts on weather • …and a tad of history….. NWS-State College
North Atlantic OscillationNAO-flow Index • A measure of the flow over the Atlantic Basin • Typically, the value is computed using MSLP departures • over Iceland and the Azores • high NAO associated with deep Icelandic low • low or negative NAO associated with ridge over Iceland and Norway • Periods of low NAO have been linked to cold in Northern Europe and North America • the Little Ice age ~1300-1860 NWS-State College
NAOhttp://www.cru.uea.ac.uk/tiempo/floor2/data/nao.htmNAO • Strictly the index should only be applied in the cold season • Recent low/negative NAO • the winter of 1995-96 • Winter Oct-Jan 2002-2003 • Historically: • NAO use to fluctuate more then in recent times • we know this from history: • wine harvest dates (later was a cold year) • wheat harvests and periods of European Famine • wheat and other grains failed or produced bad crops in cold wet years. • shipping and fishing industries back to Nordic and Basque fishing times. • They followed the water-temperature sensitive Cod fish NWS-State College
NAO-Positive Phase • Stronger than usual subtropical high pressure center and a deeper than normal Icelandic low • The increased pressure difference results in more and stronger winter storms crossing the Atlantic Ocean on a more northerly track. • Wetter in western Europe • keeps cold air out of Europe • Stronger Atlantic Jet into Western Europe (similar to EP in Pacific!) • North American Weather • in cold and dry winters in northern Canada and Greenland • The eastern US experiences mild and wet winter conditions NWS-State College
NAO-Positive Phase NWS-State College
NAO-Negative Phase • shows a weak subtropical high and a weak Icelandic low. • A reduced pressure gradient results in fewer and weaker winter storms crossing on a more west-east pathway. • Moist Atlantic air moves into the Mediterranean • cold air to northern Europe • associated with many record cold European winters • US east coast experiences more cold air outbreaks and snowy weather conditions. • Greenland, has milder winter temperatures • during the warm conditions 800-1250 AD negative NAO's may have allowed farming and fishing in Greenland NWS-State College
NAO-Negative Phase NWS-State College
NAO in recent history NWS-State College
Recent NAO 2002-03 NWS-State College
Positive Phase NAO height anomalies Trough/Ridge Enhances Atlantic Jet (Green) NWS-State College
Pacific Decadal OscillationPDA/NPO Oceanic Index • The Pacific Decadal Oscillation (PDO) is an index of long-term variability of the sea-surface temperatures of the North Pacific Ocean. • reflects the dominant mode of SST over the North Pacific Ocean. • The PDO can impact the climate. • A characteristic that distinguishes the PDO from ENSO is that 20th century PDO events have tended to persist for 20-to-30 years, while ENSO events have typically persisted for 6 to 18 months. • also known as the North Pacific Oscillation (NPO) and the terms can be used interchangeably. NWS-State College
Phases of the PDO/NPO • the high phase of the NPO is the term used to describe a warm PDO and the low phase of the NPO is the term used to describe the cold PDO. • Recent research suggests a clear link of the PDO to the ENSO. Some believe the sign of the PDO may be linked or driven by the longer term ENSO cycle. NWS-State College
PDO SST Examples NWS-State College
The cold phase • Cold PDO regimes prevailed from 1890-1950 • cold phase index is positive • the PDO was higher then average from 1920 to 1950. • cold phase may behave like a weak La Nina • note colder water in tropical Pacific dominates • may enhance impacts of La Nina when they are in phase • The cold phase occurs when there is warmer water over the western and central Pacific associated with a deepened Aleutian low. • Colder water over eastern and tropical Pacific NWS-State College
The warm phase • Warm PDO regimes dominated from 1950 through the 1980’s. • During the warm phase, the PDO is negative. • On a 30 year time scale, the PDO was lower than average from 1950 to 1980. • A negative PDO may act like an El Nino. • The warm phase occurs when there is colder water over the western and central Pacific. NWS-State College
The warm phase • Warmer and drier winters in the northern and wetter and cooler winters observed in the southern in the United States. • El Nino is associated with a negative SOI, weak tropical easterlies and warm ENSO3 SST’s. NWS-State College
PDO SST/wind vectors/MSLP anomalies NWS-State College
PDO-ENSO Similarities SST/wind vectors/MSLP anomalies NWS-State College
PDO values 1900-2000 NWS-State College
East Pacific Index (EP) • Pattern is evident all months except August and September • A north-south dipole of height anomalies over the eastern North Pacific. • The northern center is located in the vicinity of Alaska and the west coast of Canada • the southern center is of opposite sign and is found near/east of Hawaii. • May have a link to the PDO and ENSO • Weak correlation with the PNA pattern too. NWS-State College
Positive EP • Deeper than normal trough near the vicinity of the Gulf of Alaska/ western North America, and • positive height anomalies are observed farther south. • a pronounced northeastward extension of the Pacific jet stream toward western North America, • enhanced westerlies over the Pacific northwestern US, northern California, and sometimes southwestern British Columbia. • Last persistent positive phase of the EP from 1973-1975. NWS-State College
Positive EP Maps NWS-State College
Negative phase of the EP • split-flow over the eastern North Pacific, • reduced westerlies throughout the region. • a confinement of the climatological mean Pacific trough to the western North Pacific • May result in a blocking flow configuration farther east. • Persistent negative phase occurred early 1992 to mid-1993. • A period dominated by ENSO warm episode in the equatorial Pacific, • two distinct periods of mature ENSO conditions. NWS-State College
EP in recent history NWS-State College
Pacific North American Patten • Flow Pattern over North America and adjacent pacific ocean • referred to as the PNA • The standard one is from Wallace and Gutzler (1981) where they defined the index as being: z=zonal component of wind time(year)=[z(20N,160W)-z(45N,165W)+z(55N,115W)+z(30N,85W)]/ 4 NWS-State College
PNA Description • The PNA pattern is one of the most prominent modes of low-frequency variability in the Northern Hemispheric extra-tropics • appearing in all months except June and July. • The PNA pattern reflects a quadripole pattern of height anomalies, • anomalies of similar sign located south of the Aleutian Islands and over the southeastern United States. • Anomalies with sign opposite to the Aleutian center are located in the vicinity of Hawaii, and over the intermountain region of North America (central Canada) during the Winter and Fall (Spring). NWS-State College
Deep troughs Ridges Positive PNA-January NWS-State College
Conclusions • Several large scale Indices affect the flow and climatology over North America: • North Atlantic Oscillation (NAO) • Pacific Decadal Oscillation (PDO) • Pacific North American pattern (PNA) • East Pacific Index (EP) • The NAO relates to the flow over the Atlantic Ocean • Modulates Atlantic jet stream into Europe • This relates to the storm track • The EP relates to the flow over the Pacific • Modulates the Pacific Jet stream into North America • This relates to the storm track NWS-State College
Conclusions-PNA • Pacific North American pattern (PNA) • Quardripole over Pacific/North America • Positive PNA is associated with • trough over the North Pacific and southern US • Also, a strong ridge over western North America • Cold in eastern US • Negative Phase • Trough over western North America and central pacific • Ridge over southern US and Gulf of Alaska • Warm in eastern US NWS-State College
PDO Summary • Relates to ENSO cycles • Frequency of El Nino can be related to PDO phase during the past 30-40 years. • PDO can interfere both constructively and destructively with ENSO. • PDO may not be independent of ENSO • High NPO (warm phase) • Cold water in north/central Pacific • Warm water along west coast NOAM (fishing industry named phases so obvious name is not obvious!) • May act like a Positive El Nino trough in eastern US • Low NPO (cold phase) • Warm water in north/central Pacific • La Nina like impact connect with weaker storm tracks, farther north [dry-nation] NWS-State College
Web resources/Credits • NAO • http://www.ldeo.columbia.edu/NAO/ • http://www.cru.uea.ac.uk/tiempo/floor2/data/nao.htm • http://www.cpc.noaa.gov/data/teledoc/nao.html • http://www.cdc.noaa.gov/USclimate/pna.html • http://www.cpc.ncep.noaa.gov/data/teledoc/ep.html • http://tao.atmos.washington.edu/pdo/graphics.html NWS-State College
Climatic Indicesitalics-NAO Bold EP • 2002 1 0.4 1.5 -9.9 0.1 0.5 • 2002 2 1.6 1.2 -9.9 0.8 0.6 • 2002 3 0.5 0.5 -9.9 1.0 0.4 • 2002 4 2.2 -0.4 0.2 -0.1 0.9 • 2002 5 -0.7 -9.9 0.3 -0.3 0.3 • 2002 6 0.4 -9.9 2.0 0.4 0.6 • 2002 7 0.7 -9.9 0.6 -0.5 1.0 • 2002 10 -1.4 1.6 -9.9 2.5 -1.4 • 2002 11 -0.5 2.0 -9.9 0.6 -0.7 • 2002 12 -1.3 1.0 -9.9 1.4 0.4 NWS-State College
Referemces Rogers, J.C., 1997: North Atlantic storm track variability and its association to the North Atlantic Oscillation and climate variability of Northern Europe. Journal of Climate10(7), 1635-1647. Hurrell, J.W., 1995: Decadal trends in the North Atlantic Oscillation and relationships to regional temperature and precipitation. Science269, 676-679. Wallace, J.M. and David S. Gutzler, 1981:"Teleconnections in the Geopotential Height Field during the Northern Hemisphere Winter" Mon. Wea. Review,109,784-812. Teleconnections Linking Wolrdwide Climate Anomalies. ed. M.H. Glantz, R.W. Katz and N. Nicholls, Cambridge University Press, 1991. Rogers, J.C. and H. Van Loon, 1979: "The Sea-Saw in winter temperatures between Greenland and Northern Europe. Part II. Some atmospheric and oceanic effectes in middle and high latitudes." Mon Wea. Rev. ,107, 509-519. NWS-State College