Download
1 / 43
430 likes | 446 Views
Flow. The heart of plant layout and the beginning of the material handling plan. Material flow. Primary components. M. M. M. M. Manufacturers. Retailers. Wholesalers. Supplier n. Supplier 2. Customers. Supplier 1. Information flow. Flow.

E N D
Flow The heart of plant layout and the beginning of the material handling plan. Ch-5 Flow Analysis
Material flow Primary components M M M M Manufacturers Retailers Wholesalers Supplier n Supplier 2 Customers Supplier 1 Information flow Flow Flow is the continuous movement of material through the manufacturing processes and on to the customer. Ch-5 Flow Analysis
Flow If an operation with perfect flow could be established, it will nearly eliminate all waste associated with: (1) Inventory, (2)Storage space, (3) Transportation, (4) Waiting. Ch-5 Flow Analysis
The Impact of Flow Exceptional flow leads to: (1) Lower inventories (2)Better quality (3) Less floor space (4) Better communication (5) Quicker responses to problems (6) Faster throughput Ch-5 Flow Analysis
Two Basic Types of Flow Process orientation layout Ch-5 Flow Analysis
Two Basic Types of Flow Product orientation layout Ch-5 Flow Analysis
Process-oriented layout and product-oriented layout 1. Material flow will be much smoother. 2. The distance material has to travel will be much shorter. 3. There is less confusion about which process sequence to use, or when and where finished material should be transferred into next station. 4. One concern with the product-oriented layout is the restriction of the machine capacity. Instead of using one fast, flexible, expensive machine that can produce many different parts, cheaper machines that can be used solely for one part are acquired. In product-oriented layout: Ch-5 Flow Analysis
Versatile Versus Dedicated Equipment Ch-5 Flow Analysis
Flow The following lean practices merit strong consideration: (1) Pull system (2)One-piece flow (3) Cellular operation (4) Product orientation layout (5) Balanced operations Ch-5 Flow Analysis
Cellular operation Operations must be tied together in work cell. U cell: the best use of floor space Ch-5 Flow Analysis
Flow Analysis Techniques Flow analysis determines the path that every part takes through the plant, which minimizes (1) distance traveled (measured in feet), (2)backtracking, (3) cross traffic, (4) cost of production. Ch-5 Flow Analysis
Flow Analysis Techniques Flow analysis will assist the manufacturing facilities designer in the selection of the most effective arrangement of machines, facilities, workstations, and departments. If you improve the product flow, you will automatically increase profitability. A core principle of lean manufacturing is the product-oriented flow layout. Ch-5 Flow Analysis
Flow routing To establish the best arrangement of equipment, following four techniques are used: 1. A string diagram 2. A multi-column process chart 3. A from-to chart 4. A process chart Ch-5 Flow Analysis
Flow routing Example 1: 5 part-8 workstation layout. 5 parts: 1, 2, 3, 4, 5; 8 workstations: R, A, B, C, D, E, F, S. R: receiving station S: shipping end Ch-5 Flow Analysis
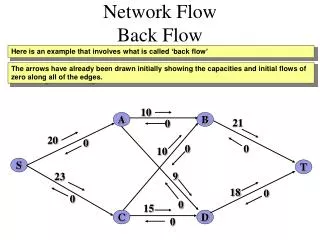
String diagram Upper lines: jumping; Lower lines: backtracking. Efficiency = 35/67 = 52% Where is the number 35 from? Ch-5 Flow Analysis
String diagram C-D: four paths B-D: two paths A-C: four paths D-S: three paths …, Efficiency = 35/67 = 52% Where is the number 35 from? Ch-5 Flow Analysis
Improved string diagram Efficiency = 35/57 = 61% How efficiency can you make this layout? Ch-5 Flow Analysis
Multi-column process chart It uses the same routing information as used in string diagram, but in different view. Ch-5 Flow Analysis
From-To Chart The from-to chart is the most exact technique of the three. We can develop an efficiency that considers the importance of the parts. Up until now, we have considered each part as equal in importance, but the quantity and weight of each part was recorded and should be considered. (Example 1 continued) Ch-5 Flow Analysis
From-To Chart From-To Chart of Part 1 with an equal importance value of 1. The routing of Part 1: RABDCFS Ch-5 Flow Analysis
From-To Chart From-To Chart –Alphabetical Layout for all 5 parts considering the importance values. Ch-5 Flow Analysis
From-To Chart(Original) From-To Chart –Alphabetical Layout for all 5 parts considering the importance values and penalty points. Upper triangle matrix: P.P. = Importance value X forward step(s) Lower triangle matrix: P.P. = IV X (2 FS) Ch-5 Flow Analysis
From-To Chart(Original) From-To Chart –Alphabetical Layout for all 5 parts considering the importance values and penalty points. Upper triangle matrix: P.P. = Importance value X forward step(s) Lower triangle matrix: P.P. = IV X (2 FS) Efficiency = 283/1077.5 = 26% Ch-5 Flow Analysis
From-To Chart(Improved) From-To Chart –Alphabetical Layout for all 5 parts considering the importance values and penalty points. Upper triangle matrix: P.P. = Importance value X forward step(s) Lower triangle matrix: P.P. = IV X (2 FS) Ch-5 Flow Analysis
From-To Chart(Improved) From-To Chart –Alphabetical Layout for all 5 parts considering the importance values and penalty points. Upper triangle matrix: P.P. = Importance value X forward step(s) Lower triangle matrix: P.P. = IV X (2 FS) Efficiency = 283/548 = 51.6% Ch-5 Flow Analysis
Flow Diagram The flow diagrams show the path traveled by each part from receiving to stores to fabrication of each part to subassembly to final assembly to packout to warehousing to shipping. These paths are drawn on a layout of the plant. The flow diagram will point out problems with such factors as cross traffic, backtracking, and distance traveled. Cross traffic: Where flow lines cross. Cross traffic is undesirable and a better layout would have less intersection paths. Anywhere traffic crosses is a problem because of congestion and safety considerations. Ch-5 Flow Analysis
Flow Diagram One part Toolbox Ch-5 Flow Analysis
Where Can One-piece Flow Processing Be Applied? A, B, C, D are workstations, and the bar indicates the cycle time. The dash line shows takt time for the processes. Ch-5 Flow Analysis
Where Can One-piece Flow Processing Be Applied? • The largest cycle time in the line should be less than takt time. • The line should be balanced (The cycle times should be even). Figure-13 shows re-balanced cycle times for the line. To balance the line, process D is taken off form the line. Ch-5 Flow Analysis
Balancing Concerns • Bottlenecks: overloaded work stations (large cycle time stations) that do not have enough capacity for the prescribed load. • Bottlenecks dictate throughput. • Time saved at a non-bottleneck saves the system nothing. • Using a non-bottleneck 100% of the time does not produce 100% utilization. • The capacity of the system depends on the capacity of the bottleneck. Ch-5 Flow Analysis
Managing Bottlenecks • Establish time buffer before each bottleneck. • Control the rate of material feeding the bottleneck (gate operation). • Do everything to increase capacity of bottleneck. • Adjust loads, change schedule. Loads that can be split, should be. Ch-5 Flow Analysis
Push or Pull? In a push system, the traditional manufacturing, items from one workstation are “pushed” onto the succeeding workstation indiscriminately, regardless if that plant is ready to process the items or not. The material movement is scheduled by ‘plan.’ That plan is made some time before and based on forecasting. This is a production-oriented approach. Ch-5 Flow Analysis
Push or Pull? A push system Ch-5 Flow Analysis
Push or Pull? The main advantages of push system are: (a) It spreads overhead cost and continuous utilization of people and equipment. (b) It allows for the development of well-integrated production plant. (c) It is most familiar to the employees. (d) It has the flexibility to produce various product types. Ch-5 Flow Analysis
Push or Pull? The following problems may occur in push system: (1) High inventories (or WIP) (2)Potential quality problem (3) High floor space (4) Poor communication (5) Slow responses to problems (6) Over production or shortage (7) Queuing or starvation Ch-5 Flow Analysis
Push or Pull? In a pull system:production is triggered by the demand at the final stage. At each intermediate stage, it is triggered by its succeeding stage(s)—this process is carried all the way from the final stage to the beginning stage. Thus, the production is controlled (i.e., pulled) by demand of the succeeding stage. The JIT (Just-in-time) system is easily implemented. Kanban is usually a tool for ‘pull’ production system. Lean manufacturing likes pull badly. It is a customer-oriented approach. Ch-5 Flow Analysis
Push or Pull? A pull system Ch-5 Flow Analysis
Push or Pull? The main advantages of the pull system are: (a) It is relatively inexpensive as it does not require a comprehensive entourage of employees and information processing equipment to be functional. (b) Inventory is not perpetual. (c) The production model reflects the actual production better. (d) The approach leads itself to a very simple control mechanism, best known as kanban system. The workers working in a kanban controlled production line only need to follow the simple rule: No kanban, no production. Ch-5 Flow Analysis
Push or Pull? The disadvantages of the pull system are: (1) People and equipment may not be fully in use at all times. (2) No detailed plans. (3) People are unfamiliar with a pull system. (4) It does not maintain the same level of flexibility as push system. Ch-5 Flow Analysis
Push or Pull? Spearman and Zazanis (1992) examined the behavior of push and pull production systems. After comparisons, they included three conjectures: (1) pull systems had less congestion. (2) pull systems were inherently easier to control. (3) the benefits of a pull environment owed more to the fact that WIP was bounded than to the practice of “pulling” everywhere. Ch-5 Flow Analysis