Download
1 / 18
180 likes | 274 Views
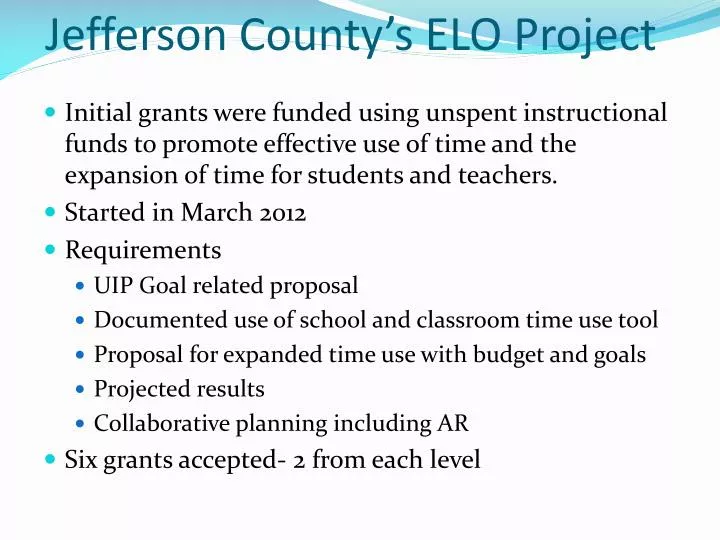
Jefferson County’s ELO Project. Initial grants were funded using unspent instructional funds to promote effective use of time and the expansion of time for students and teachers. Started in March 2012 Requirements UIP Goal related proposal Documented use of school and classroom time use tool

E N D
Jefferson County’s ELO Project • Initial grants were funded using unspent instructional funds to promote effective use of time and the expansion of time for students and teachers. • Started in March 2012 • Requirements • UIP Goal related proposal • Documented use of school and classroom time use tool • Proposal for expanded time use with budget and goals • Projected results • Collaborative planning including AR • Six grants accepted- 2 from each level
Conifer High School’s ELO project • Dylan William’s a senior researcher at ETS “”… the single most important thing to change in teachers’ practice is the minute-to-minute and day-to-day use of assessment to adjust instruction. Because this involves sustained change in deeply ingrained practices and habits, this will necessitate a different type of teacher professional development: building –based teacher learning communities.” • This concept layered on John Hattie’s research on activities that impact student achievement levels, • Conifer has been focusing on the many of the items listed below. (Note that .40 effect size (ES) is equal to approximately one year of achievement growth.) UIP focus Quality lesson design to be guided by formative assessments Guided by Micro teaching Student and the teacher knowing the daily objective Feeback received by the student
Confier’s Goal • Our goal is to provide structures and an observation tool (OCI: Time and Learning Tool) to our instructional leaders (ILs) so they can complete peer observations that lead to pedagogical teacher learning teams which focus on impactful strategies and activities that can be implemented in the our classrooms. • Our collective vision is that all teachers at CHS can observe, coach, support and help teachers implement impactful strategies and activities that are aligned to guaranteed and viable curriculum (CAP) which in turn will lead to increased student achievement.
Collaborative Time & Learning Columbine & Conifer HS, Jeffco Schools
A Teacher-to-Teacher Observation Methodology • Gathers inside-the-classroom measures of actual teaching strategies. • Teachers embrace the data because they are objective, research-based, and actionable. • Cultivates trust, collaboration, & cross-fertilization of ideas among teachers. • Reinforces consistency of language and understandings of research. • No overhead burden because our teachers become the observation experts. • An Inside-Out approach, consistent with TQM and business transformation principles. Defining Characteristics
Data Applications • Illuminating sources of variability • Teacher Analysis • Departmental Analysis • School Analysis • Inter-School Analysis Collaborative Time & LearningProcess Flow • Capturing Research-Based Teaching Strategies • Objective Measures • Nonintrusive • Trustworthy • Collaborative Reflection • Examine What Measures Say • Consider Strategies Vs. Student Engagement • Form Professional Improvement Plan • Pre-Conference • Classroom Observation • Post-Conference • Peer Observation Prep
PRE-CONFERENCE Teacher & Observer Capture “look-for”s and teacher requests before the observation
OBSERVATION Observer During classroom session, observer selects buttons corresponding to research’s best teaching strategies as they occur. This tracks chronology and duration of teacher’s strategies.
OBSERVATION Observer also takes notes and captures student engagement levels.
POST-CONFERENCE Observer and teacher meet to discuss observation and reflect upon learnings and develop plans of action.
POST-CONFERENCE A snapshot of the observation is kept on record for teachers, observers, and administrators. This information facilitates the post-conference discussion. It helps form PD priorities.
POST-CONFERENCE Research-Based Analysis Teacher/Observer can examine the time spent on high impact strategies, as determined by research, and student engagement levels, to help form conclusions.
TEACHER ANALYTICS Teacher Dashboards Teachers can access their classroom observation history and monitor changes in their strategy profiles over time.
TEACHER ANALYTICS Strategy Analysis Teachers can analyze how they utilize classroom time relative to research (e.g, Hattie) and their levels of student engagement. Teacher-to-Teacher profile changes over time. Teacher-to-Department (shown). Teacher-to-Population
DEPARTMENT ANALYTICS Department Dashboards Departments can monitor, month-to-month observation activity and department-level changes in strategies.
INTER-SCHOOL ANALYTICS Inter-School Analysis Schools can be compared. Root sources of variability among schools can be illuminated.
SCHOOL ANALYTICS Capacity Analysis As Observation Sample Size Grows, actual in-class time utilizations can be objectively derived for the school as a whole. We can quantitatively estimate the amount of time students are actually being exposed to specific strategies. E.g., The number of hours/week “English” students at “Conifer” are exposed to “Lecture” strategies. Drawing focus to school-specific improvement priorities.
Project Cost IL POSITIONS 2012-2013 Budgeted IL Positions .90 of $77,000 Average Teacher Salary Positions: Coordinator .20 Social Studies .10 Math (2) .20 Science .10 WL & Co-Taught Sped .10 Electives .10 English .10 TOTAL- .90 (District FTE) or $69,300 Added: • ( .10) or $7700 CHS building staffing which I gave to my 2011-12 coach who decided to return to the classroom fulltime. • His role was too help the coordinator implement the “Time and Learning” observation program. • Applied and received a $10,000 “Time & Learning” Grant for two (2) full days of IL development: (July – 16 hours for 9 teachers to begin work on a cognitive coaching/critical friend’s hybrid model). This retreat helped build coaching capacity for my ILs. This also paid for five IPads for ILs to support them when they observed teachers. • This grant also paid for $6000 of consulting from a retire coach (Joey Wilson)*. • 3a. We contracted with Essent Partners to purchase a web based timing tool to warehouse house teacher time data for $1500. • Later used $3800 of building funds to obtain more time from Joey. $69,300 District provided FTE $10,000 Time & Learning Grant $11,500 Building Staffing & Building funds Total $90,800 This is the first year cost and next year it will cost the coaching staffing or $69,300.