Download
1 / 20
200 likes | 217 Views
Moscow State University, Russia Faculty of physics and International Laser Center. RAMAN AND ATR FTIR SPECTROSCOPY IN THE STUDY OF CHEMICAL REACTION RATES. I.A. Balakhnina, N.N. Brandt , A.Yu. Chikishev, A.A. Mankova, I.G. Shpachenko. How to measure reaction rate ?.

E N D
Moscow State University, Russia Faculty of physics and International Laser Center RAMAN AND ATR FTIR SPECTROSCOPYIN THE STUDY OF CHEMICAL REACTION RATES I.A. Balakhnina, N.N. Brandt, A.Yu. Chikishev, A.A. Mankova, I.G. Shpachenko
How to measure reaction rate? Reaction rate= Rate of changes in reagent (product) concentration Universal method is unavailable Experimentally prove the applicability of vibrational spectroscopy in the measurements of chemical reaction rates Task:
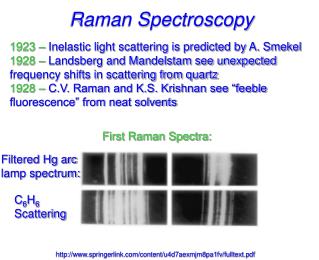
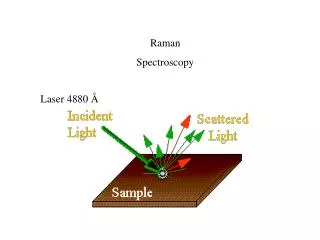
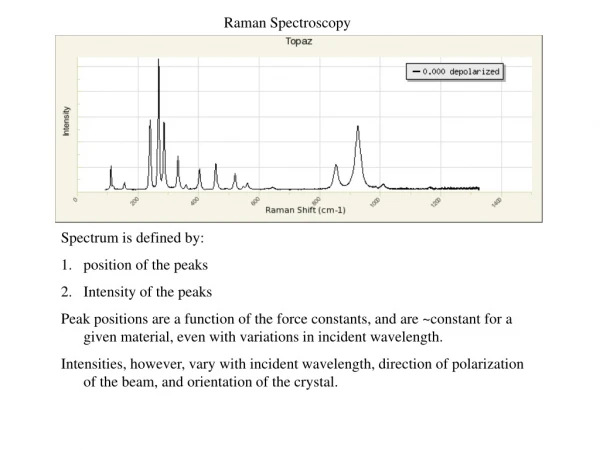
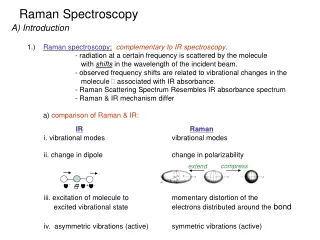
Reaction of alkaline hydrolysis of ethyl acetate:Raman spectroscopy of the components Raman spectrum of the reaction and its approximation with linear combination of Raman spectra of the components: ethyl acetate(CH3COOC2H5), ethanol(C2H5OH),potassium acetate (CH3COOK), and KOH.
Processing of Raman data series Intensity kinetics Reaction rate k
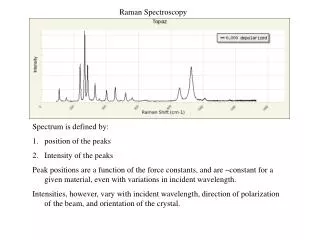
Temperature dependence of reaction rates Raman spectra of the reaction mixture (hydrolysis of ethyl acetate), measured at 14-2110 s from the beginning of reaction at a temperature of 22 °C Time dependence of the integral Raman intensity of the band at 880 cm-1measured at different temperatures An increase in temperature leads to an increase in reaction rate
Reaction rate and activation energy А – const Еа – activation energy R – gas constant Т – temperature Reaction rates of ethyl acetate hydrolysis at different temperatures
Reaction rates of alkaline hydrolysis of ethyl acetatedetermined using different spectral lines Time dependences of Raman intensity of the bands at 880, 929, and 852сm-1at a temperature of 25 °Cand their approximations Raman spectra of the reaction of ethyl acetate hydrolysis, measured at 20-600 seconds from the beginning of reaction at a temperature of 25 °C k = 0,088±0,006 M-1s-1 Mean value of the reaction rate is
Raman spectroscopy of spontaneousand enzymatic hydrolysis Raman spectra of the reaction of enzymatic hydrolysis of 2,4-dinitrophenylacetate (DNPA) in the presence of chymotrypsin, measured at 100 s - 260 min from the beginning of reaction 14°С pH 7,8 Enzymatic hydrolysis: Spontaneous hydrolysis: kh= (1,26±0,01)10-5 s-1 KM= (39,55±0,01)10-4 M S – substrate; E – enzyme; P – product; ES – enzyme-substrate complex
ATR FTIR geometry Evanescent wave d ATR crystal (diamond) Incident IR light Reflected IR light
Reaction of alkaline hydrolysis of ethyl acetate: ATR FTIR spectroscopy of the components ATR FTIR spectrum of the reaction mixture at 17 s and the spectra of the components: ethyl acetate(CH3COOC2H5), ethanol(C2H5OH),potassium acetate (CH3COOK), and KOH
Reaction rates: ATR FTIR spectroscopy ATR FTIR spectra of the reaction of ethyl acetate hydrolysis, measured at 13-300 s from the beginning of reaction at a temperature of 27,4 °C Time dependence of the area under the band at 1265cm-1measured at 27.4 °C and its approximation
ATR FTIR time-dependence: liquid-in-liquid solution Concentration changes are obvious Solvent evaporation? Interaction with ATR crystal surface? Molar ratio: Ethanol / Benzoic ether = 5
ATR FTIR time-dependence: solid-in-liquid solution Molar ratio: Acetonitrile / DNPA = 100 In case of reaction: product increasing rate = reagent decreasing rate
Reaction rates: ATR FTIR spectroscopy 1264, 1300, 1359, 1393, 2800-3100 cm-1unchanged 607, 634, 785, 847, 916, 938, 1097, 1115, 1373 cm-1– intensity 1045, 1238 cm-1(skeletal) – intensity and width Ethyl acetate ordering (crystallization) on diamond surface
Conclusions • Raman spectroscopy makes it possible to locally measure the rates of chemical processes (including enzymatic) in experiments with liquids and solids in the absence of specific requirements to reagents (substrates) • Raman measurements make it possible to determine rate constants using variations in intensities of several spectral bands, so that the accuracy of calculations can be increased • In the case of ATR FTIR measurements, the phase transition of liquids into quasi-crystalline state on the surface of ATR crystal is possible (even for diamond)
Взаимодействие гомогенных растворов с алмазом ИК спектры 2,1 М этилового эфира бензойной кислоты (этилбензоата) в этиловом спирте из серии, измеренные через 15(черная кривая), 100 (красная кривая) и 200 секунд (синяя кривая) после начала измерений на кристалле НПВО. ИК спектры 190 мМ раствора 2,4-динитрофенил ацетата в ацетонитриле из серии, измеренные через 3(черная кривая), 100 (красная кривая) и 200 секунд (синяя кривая) после начала измерений на кристалле НПВО. ИК спектры фосфатного буфера из серии, измеренные через 3 (черная кривая), 100 (красная кривая) и 200 секунд (синяя кривая) после начала измерений на кристалле НПВО. Все спектры совпадают.
ATR FTIR spectroscopy of spontaneousand enzymatic hydrolysis Four reaction kinetics at 1380 см-1 ATR FTIR spectra of spontaneousreaction of 100 mM ethyl acetate hydrolysis, measured at 11-600 s from the beginning of reaction at the temperature of 23,5 °C ATR FTIR spectra of ethyl acetate measured at 3, 100, and 200 s after the beginning of reaction