Download
1 / 32
320 likes | 483 Views
Anne-Marie E.G. Brunner-Suzuki June 15 th , 2007. Interannual Variability of Satellite-Derived Sea Surface Temperature in the Western North Atlantic Shelf and Slope, 1985-1999 M.S. Thesis Presentation. Introduction and Background. Western North Atlantic Shelf and Slope.

E N D
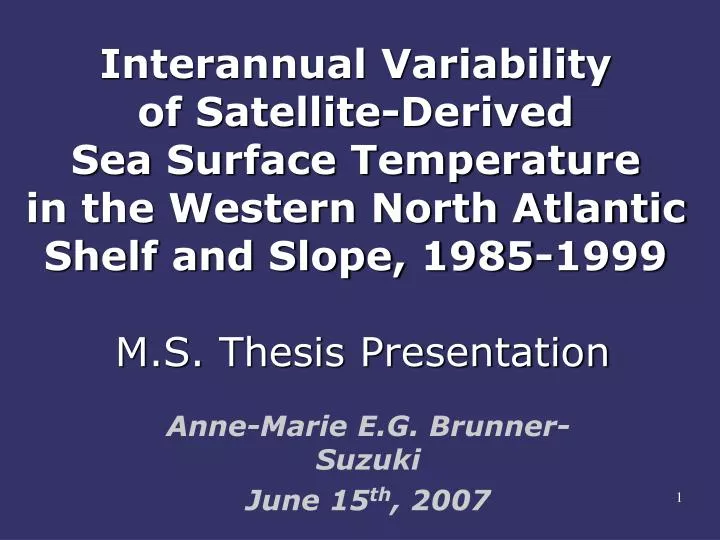
Anne-Marie E.G. Brunner-Suzuki June 15th, 2007 Interannual Variability of Satellite-Derived Sea Surface Temperature in the Western North Atlantic Shelf and Slope, 1985-1999 M.S. Thesis Presentation
Western North Atlantic Shelf and Slope Adapted from Chapman and Beardsley (1989). ; a) Smith et al.(1987); b) Collin and Dunbar(1964); c) Petrie and Anderson (1983); d) Drinkwater et al.(1979); e) Smith (1963); f) Rump et al. (1985); g) Beardsley et al. (1985)
The Slope Sea Transition zone • between coastal waters and open ocean • waters originating from the sub-polar and sub-tropical gyre meet and interact • water mass variability associated with NAO variability Adapted from Csanady and Hamilton (1988) G76: Gatien, 1976 PD93: Petrie and Drinkwater 1993 ML57: McLellan 1957
North Atlantic Oscillation (NAO) • High NAO: • Decreased Labrador Current transport • LSW to Cabot Strait • Slope Sea dominated by WSW • Northern Gulf Stream North Wall • Myers et al., 1989; Petrie and Drinkwater, 1993; Han, 2002 • Low NAO: • Increased Labrador Current transport • LSW as far south as MAB • Southern Gulf Stream North Wall (Gatien, 1976; Flagg et al., 1998; Rossby, 1999; Greene and Pershing, 2001) Positive NAO Negative NAO From: http://www.gomoos.org/nao/page5.html
Preliminary SST results Negative NAO Positive NAO
Motivation or why it is interesting NAO high low Gatien, 1976; Petrie and Drinkwater, 1993 increased Labrador Current transport decreased Labrador Current transport Townsend, et al. 2004 Warm, salty, nitrate-rich WSW in Slope Sea Cold, fresh, nitrate-depleted LSW in Slope Sea Gulf Stream more southern Joyce, Gangopadhyay Gulf Stream more northern Decreased Chla Schollaert, et al. 2004 Increased Chla Increased Calanus f. Greene etal., 2003 Decreased Calanus f.
Hypothesis NAO Interannual Variability of Local Forcings (Wind, Qnet) Southwestward extent of Labrador Current Interannual variability of SST in the western North Atlantic
Data • 15 years of satellite-derived Sea Surface Temperature (SST) from the Advanced Very High Resolution Radiometer • ADCP temperature data at M/V Oleander provided by Dr. C. Flagg • Shipboard SST data at the Halifax section from the BIO database • Gulf Stream North Wall and shelf slope frontal positions provided by Dr. K.Drinkwater and Dr. R.Pettipas. • Local forcing is estimated using National Center for Environmental Prediction (NCEP) gridded reanalysis products: • net heatfluxQnet (Qnet = sensible + latent + shortwave + longwave) • windmagnitude (W) (W= sqrt (u^2+v^2))
Compute quality controlled, monthly SST, W and Qnet anomalies: monthly anomalies were computed, by subtracting individual long-term means from the 180 monthly means. Apply data to a bathymetry-following grid: spatially smoothing of the data by applying a coarse (628 bins) grid following shelf and slope Validate data with in situ data Conduct an Empirical Orthogonal Function (EOF) analyses for SST, Qnet and Wind to determine IAV of SST Methods I
Methods II • Perform a regression analysis between the resulting EOF modes and Hurrell’s North Atlantic Oscillation (NAO) seasonal index • Perform across-correlation analysis • Create a composited SSTA data set • Compare sections along the shelf and slope to identify cold events • Computepropagation speeds • Conduct aComplex EOF analysis to study propagating signals for SSTA The goal was to identify and quantify cold intrusions into the Slope Sea.
AVHRR SST and in situ SST Halfiax 27 M/V Oleander RMS: 1.02 deg.C (83%) RMS: 1.34deg.C (81%) In situ data areinstantaneous, single measurements. AVHRR are monthly averages. Satellite measureskin temperature, ADCP at 6m depth, shipboard data are below surface; also data availability influences the results.
Spatial EOF SST anomaly results • Results were evaluated using North's Rule of Thumb, a Monte Carlo test and spatial dependency test.
Regression Analysis Explained variance at zero lag between NAO and SST EOF modes 1-4 is low. R-Values
Cross-correlation The maximum influence of Qnet anomalies or W-anomalies onto SST anomalies is only 5%.
Onshelf-Offshelf Comparison • 7 sections along the shelf results from the EOF-noise reduced composited data • Different r-values • Different dominant frequencies • Red are onshelf regions, Black are offshelf
The classic 1997/1998 “Cold Event” 1 2 3 4 Adapted from Drinkwater et al. (1999). 5 6
Propagation Speed Cold Events • 6cm/s – 20cm/s (here) • 3cm/s (Houghton and Visbeck, 2002) • 4cm/s (Mountain 2003; Bisagni et al, 2006) - shelf • 7cm/s (Chapman and Beardsley, 1989) - shelfbreak • 3;13cm/s ( Belkin, 2004) – observed only north of the Grand Banks; (1970s;1990s) mean current speed • 9cm/s (Lazier and Wright, 1993; Pickart et al., 1999) -slope • 12cm/s (Fratantoni and Pickart, in press) - slope • 15cm/s (Flagg et al., 2006) - slope synoptic current speeds • 35cm/s (Pickart et al., 1999; Flagg et al., 2006)
Complex EOF 1 arrow length: amplitude arrow direction: phase phase amplitude
Complex EOF 2 arrow length: amplitude arrow direction: phase
Summary • Low correlation and significance levels suggest other mechanismsbesides climate-related variability of surface forcing from winds and net heat flux related to the NAO are important in the shelf-slope region of the western North Atlantic ocean. • Other mechanisms includehorizontal advection and may include vertical mixing and may play a large role in controlling interannual variability of SST. • Propagation speeds of different “cold events” range from 6cm/s to 20cm/s, thus being on the order of mean current speeds in the slope region. • The 2nd CEOF mode suggests faster propagation speeds in the Slope Sea, than onshelf. • Most observed “cold events” are first seen offshore, than onshore, suggesting thatthe slope is driving the shelf. However, not so during 1992.
CEOF 1 exhibits northeastward propagation of SSTA, possibly indicating the importance of the separation of the Gulf Stream from the shelf break. • CEOF/EOF 2 is related to the cold intrusions from the north and it is negative during offshore positions of the shelf slope front. • Results indicate, that observed SST IAV results from propagating temperature anomalies and is not caused by local forcings. • The intrusion of LSW into the Slope Sea is important for the ecosystem of the North American continental shelf and Slope Sea as it is thought to influence biological production through a nitrate-controlled bottom-up control mechanism; i.e. inter- and intra-annual physical forcing controls the dynamics of phytoplankton and zooplankton and higher trophic levels.
Acknowledgments • Dr.P.Cornillon (AVHRR data), Dr.C.Flagg (ADCP data), Dr.R.Pettipas (digitized SSF, GSNW position) for providing valuable data. • Source of funding: NSF Grants OCE-0217122 and OCE-0227679 under the joint NSF/NOAA US-GLOBEC Northwest Atlantic Georges Bank Program. • My advisorDr. J.J.Bisagni and my Thesis Committee Dr.A.Bower, Dr.A.Gangopadhyay, Dr.M.Zhou for their guidance and kind support in the course of this research. • My fellow graduate students and many faculty at SMAST and UMassD • My friends at SMAST and other places in this world • My parents G.+Dr.C.Brunner and siblings J., C., F.Brunner and many other family members • My husband N.Suzuki