Download
1 / 4
40 likes | 117 Views
Jane. Bill. Joe. Mark. Karen. Mary. Annette. Kristen. Doug. Dave. John. Phil. Beth. Danny. Donna. April. 62. 73. 79. 83. 90. 67. 97. 87. 78. 83. 42. 75. 57. 65. 71. 75. Determining STANDARD SCORE of a data value from a distribution.

E N D
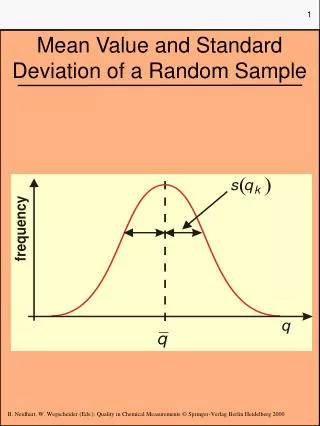
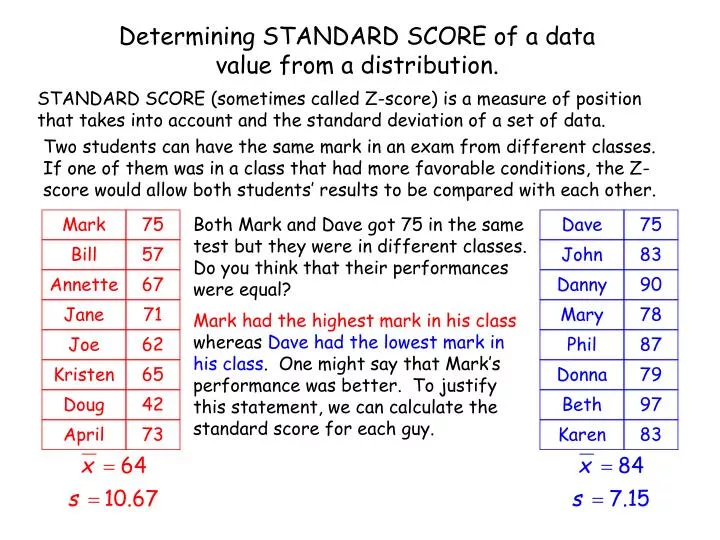
Jane Bill Joe Mark Karen Mary Annette Kristen Doug Dave John Phil Beth Danny Donna April 62 73 79 83 90 67 97 87 78 83 42 75 57 65 71 75 Determining STANDARD SCORE of a data value from a distribution. STANDARD SCORE (sometimes called Z-score) is a measure of position that takes into account and the standard deviation of a set of data. Two students can have the same mark in an exam from different classes. If one of them was in a class that had more favorable conditions, the Z-score would allow both students’ results to be compared with each other. Both Mark and Dave got 75 in the same test but they were in different classes. Do you think that their performances were equal? Mark had the highest mark in his class whereas Dave had the lowest mark in his class. One might say that Mark’s performance was better. To justify this statement, we can calculate the standard score for each guy.
Mark Kristen Joe Doug Bill Dave Jane April Annette Phil Beth Donna Danny Mary Karen John 83 97 67 71 73 75 42 87 65 90 57 79 78 75 83 62 Mark’s standard score is positive indicating that his mark is above average.Dave’s standard score is negative indicating that his mark is below average. The standard score for an individual data value is generally between -3 and 3. For any data value equal to the mean of the set of data values, its standard score is zero. Data values below the mean have a negative standard score and those above the mean have a positive standard score.
Dave Danny Beth Phil John Fiona Mary Karen Donna Jill Susan Lucas Sarah Lanny Derek Andy 97 87 90 78 83 79 83 78 75 85 92 83 84 81 79 90 Jill is from a third class. She has a mark of 90 which is the same as Donna’s from the second class. Not only are their marks the same but so are the means of both of their classes. The standard score is the number of standard deviations that a particular data value is removed from the mean. Jill is more standard deviations removed from her class’s mean than Donna. Given its lower standard deviation, the marks from Jill’s class are less dispersed. This makes her mark being 6 above the average more commendable than Donna’s.
Dave Danny Phil Beth John Fiona Mary Karen Donna Jill Susan Lucas Sarah Lanny Derek Andy 97 83 85 90 78 79 83 78 79 87 92 83 84 81 75 90 Mary and Andy are from those different classes. They both have a mark of 78 – a below mean mark. This means that their standard scores will be negative. Andy is more standard deviations below his class’s mean than Mary. Given its lower standard deviation, the marks from Andy’s class are less dispersed. This makes his mark being 6 below the average even less commendable than Mary’s.