Download

1 / 21
210 likes | 294 Views
Sampling from a MVN Distribution. BMTRY 726 1/17/2014. Sample Mean Vector. We can estimate a sample mean for X 1, X 2, …, X n. Sample Mean Vector. Now we can estimate the mean of our sample But what about the properties of ? It is an unbiased estimate of the mean

E N D
Sampling from a MVN Distribution BMTRY 726 1/17/2014
Sample Mean Vector • We can estimate a sample mean for X1,X2, …, Xn
Sample Mean Vector • Now we can estimate the mean of our sample • But what about the properties of ? • It is an unbiased estimate of the mean • It is a sufficient statistic • Also, the sampling distribution is:
Sample Covariance • And the sample covariance for X1,X2, …, Xn • Sample variance • Sample Covariance
Sample Mean Vector • So we can also estimate the variance of our sample • And like , S also has some nice properties • It is an unbiased estimate of the variance • It is also a sufficient statistic • It is also independent of • But what about the sampling distribution of S?
Wishart Distribution Given , the distribution of is called a Wishart distribution with n degrees of freedom. has a Wishart distribution with n -1 degrees of freedom The density function is where A and S are positive definite
Wishart cont’d • The Wishart distribution is the multivariate analog of the central chi-squared distribution. • If are independent then • If then CAC’ is distributed • The distribution of the (i, i) element of A is
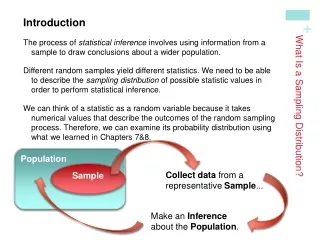
Large Sample Behavior • Let X1,X2, …, Xnbe a random sample from a population with mean and variance (not necessarily normally distributed) Then and Sare consistentestimators for m and S. This means
Large Sample Behavior • If we have a random sample X1,X2, …, Xna population with mean and variance, we can apply the multivariate central limit theorem as well • The multivariate CLT says
Checking Normality Assumptions • Check univariate normality for each component of X • Normal probability plots (i.e. Q-Q plots) • Tests: • Shapiro-Wilk • Correlation • EDF • Check bivariate (and higher) • Bivariate scatter plots • Chi-square probability plots
Univariate Methods • If X1, X2,…, Xn are a random sample from a p-dimensional normal population, then the data for the ith trait are a random sample from a univariate normal distribution (from result 4.2) • -Q-Q plot • Order the data • Compute the quantiles according to • Plot the pairs of observations
Correlation Tests • Shapiro-Wilk test • Alternative is a modified version of Shapiro-Wilk test • Uses correlation coefficient from the Q-Q plot • Reject normality if rQ is too small (values in Table 4.2)
Empirical Distribution Tests • Anderson-Darling and Kolmogrov-Smirnov statistics measure how much the empirical distribution function (EDF) differs from the hypothesized distribution • For a univariate normal distribution • Large values for either statistic indicate observed data were not sampled from the hypothesized distribution
Multivariate Methods • You can generate bivariate plots of all pairs of traits and look for unusual observations • A chi-square plot checks for normality in p> 2 dimensions • For each observation compute • Order these values from smallest to largest • Calculate quantiles for the chi-squared distribution with p d.f.
Multivariate Methods • Plot the pairs Do the points deviate too much from a straight line?
Things to Do with non-MVN Data Apply normal based procedures anyway Hope for the best…. Resampling procedures Try to identify an more appropriate multivariate distribution Nonparametric methods Transformations Check for outliers
Transformations • The idea of transformations is to re-express the data to make it more normal looking • Choosing a suitable transformation can be guided by • Theoretical considerations • Count data can often be made to look more normal by using a square root transformation • The data themselves • If the choice is not particularly clear consider power transformations
Power Transformations • Commonly use but note, defined only for positive variables • Defined by a parameter l as follows: • So what do we use? • Right skewed data consider l< 1 (fractions, 0, negative numbers…) • Left skewed data consider l> 1
Power Transformations • Box-Cox are a popular modification of power transformations where • Box-Cox transformations determine the best l by maximizing:
Transformations • Note, in the multivariate setting, this would be considered for every trait • However… normality of each individual trait does not guarantee joint normality • We could iteratively try to search for the best transformations for joint and marginal normality • May not really improve our results substantially • And often univariate transformations are good enough in practice • Be very cautious about rejecting normality
Next Time • Examples of normality checks in SAS and R • Begin our discussion of statistical inference for MV vectors