Download
1 / 1
10 likes | 129 Views
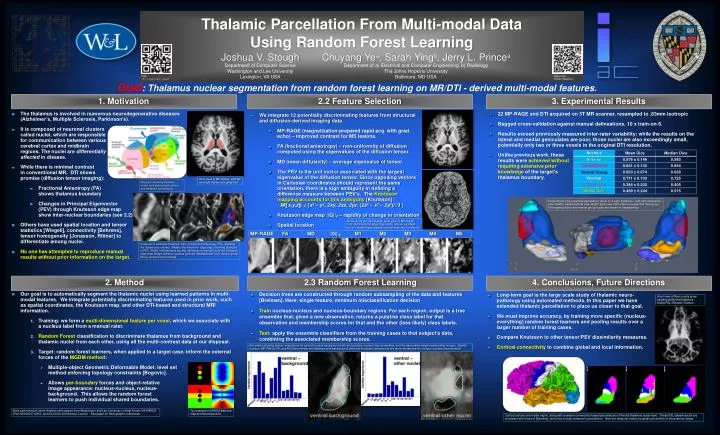
Thalamic Parcellation From Multi-modal Data Using Random Forest Learning Joshua V. Stough Chuyang Ye a , Sarah Ying b , Jerry L. Prince a. Web: http://cs.wlu.edu/~stough. Paper Site Poster: WeAT4.4.

E N D
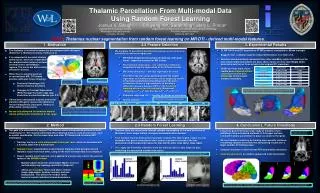
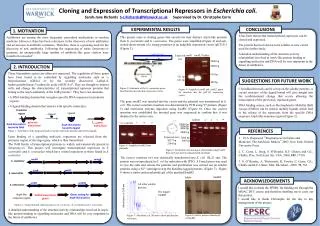
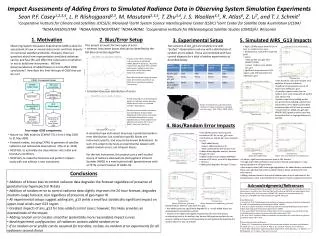
Thalamic Parcellation From Multi-modal Data Using Random Forest Learning Joshua V. StoughChuyang Yea, Sarah Yingb, Jerry L. Princea Web: http://cs.wlu.edu/~stough Paper Site Poster: WeAT4.4 Goal: Thalamus nuclear segmentation from random forest learning on MR/DTI - derived multi-modal features. 3. Experimental Results 1. Motivation 2.2 Feature Selection • The thalamus is involved in numerous neurodegenerative diseases (Alzheimer’s, Multiple Sclerosis, Parkinson’s). • It is composed of neuronal clusterscalled nuclei, which are responsible for communication between various cerebral cortex and midbrain regions. The nuclei are differentially affected in disease. • While there is minimal contrastin conventional MR, DTI showspromise (diffusion tensor imaging): • Fractional Anisotropy (FA) shows thalamus boundary • Changes in Principal Eigenvector (PEV) through Knutsson edge mapshow inter-nuclear boundaries (see 2.2). • Others have used spatial location and tensor statistics [Wiegell], connectivity [Behrens], tensor homogeneity [Jonasson, Rittner] to differentiate among nuclei. • No one has attempted to reproduce manual results without prior information on the target. 22 MP-RAGE and DTI acquired on 3T MR scanner, resampled to .83mm isotropic Bagged cross-validation against manual delineations, 10 x train-on-5. Results exceed previously measured inter-rater variability; while the results on the lateral and medial geniculates are poor, those nuclei are also exceedingly small, potentially only two or three voxels in the original DTI resolution. Unlike previous work, theseresults were achieved without requiring extensive prior knowledge of the target’s thalamus boundary. • We integrate 12 potentially discriminating features from structural and diffusion-derived imaging data. • MP-RAGE (magnetization-prepared rapid acq. with grad. echo) –improved contrast for MS lesions. • FA (fractional anisotropy) – non-uniformity of diffusion computed using the eigenvalues of the diffusion tensor. • MD (mean diffusivity) – average eigenvalue of tensor. • The PEV is the unit vector associated with the largest eigenvalue of the diffusion tensor. Since opposing vectors in Cartesian coordinates should represent the same orientation, there is a sign ambiguity in defining a difference measure between PEV’s. The Knutssonmapping accounts for this ambiguity [Knutsson]:M([x,y,z]) = {x2 – y2, 2xy, 2xz, 2yz, (2z2 – x2 – 2y2)/√3 } • Knutssonedge map ||G||F – rapidity of change in orientation • Spatial location Axial view in MP-RAGE, with left and right thalamus highlighted. Diagram showing thalamic nuclei and associated cortical and midbrain connectivity. Perspectives of an example parcellation result on a right thalamus. Left: canonical axial view. Middle: sagittal lateral view. Right: axial view from inferior perspective (facing up). The larger pulvinar and ventral group nuclei are shown in transparency. Above and right: whole brain axial view of MP-RAGE (top) and Knutsson edge map (right). Below: example vector-valued image (spatial location features not shown). MP-RAGE FA MD ||G||F M1 M2 M3 M4 M5 Close-up of example thalamus. Left: in fractional anisotropy (FA), showing the thalamus boundary. Middle: the Knutsson edge map, showing changes in PEV. Right: left thalamus nuclear delineation (manual) from the Knutsson edge map image: anterior nucleus [yellow], medialdorsal [red], ventral group [blue], and pulvinar [orange]. 2. Method 2.3 Random Forest Learning 4. Conclusions, Future Directions Decision trees are constructed through random subsampling of the data and features [Breiman].Here: single feature, minimum misclassification decision Train nucleus-nucleus and nucleus-boundary regions. For each region, output is a tree ensemble that, given a new observation, returns a putative class label for that observation and membership scores for that and the other (less likely) class labels. Test: apply the ensemble classifiers from the training cases to that subject’s data, combining the associated membership scores. • Our goal is to automatically segment the thalamic nuclei using learned patterns in multi-modal features. We integrate potentially discriminating features used in prior work, such as spatial coordinates, the Knutsson map, and other DTI-based and structural MRI information. • Training: we form a multi-dimensional feature per voxel, which we associate with a nucleus label from a manual rater. • Random Forest classification to discriminate thalamus from background and thalamic nuclei from each other, using all the multi-contrast data at our disposal. • Target: random forest learners, when applied to a target case, inform the external forces of the MGDM method: • Multiple-object Geometric Deformable Model: level set method enforcing topology constraints [Bogovic]. • Allows per-boundaryforces and object-relative image appearance: nucleus-nucleus, nucleus-background. This allows the random forest learners to push individual shared boundaries. Long-term goal is the large scale study of thalamic neuro-pathology using automated methods. In this paper we have extended thalamic parcellation to place us closer to that goal. We must improve accuracy, by training more specific (nucleus-everything) random forest learners and pooling results over a larger number of training cases. Compare Knutsson to other tensor/PEV dissimilarity measures. Cortical connectivity to combine global and local information. Axial view of fiber counts given seeding within the thalamus. Using FSL Diffusion Toolbox. Bar charts showing feature importance for typical nucleus-background (left) and nucleus-nucleus tree ensembles, and the associated target membership images. Spatial location, MP-RAGE, FA, and MD discriminate the thalamus with background, while the Knutsson dimensions are more informative for nucleus-nucleus discrimination. Work performed at Johns Hopkins with support from Washington and Lee University Lenfest Funds, NIH/NINDS 2R01NS056307-06A1, and the China Scholarship Council. See paper for bibliographic references. Toy example of MGDM distance map and decomposition. Cortical surface colored by region, along with example connectivity-based parcellations of the left thalamus (axial view). These FSL-based results are consistent with those of [Behrens], and show a large variance in parcellation. Note the temporal versus occipital connectivity of the posterior areas.